


The Short Answer
Fort Lauderdale’s waterfront house market gets harder to sell the more you spend, and the gradient is steep enough to change how you should buy.
Between $1 million and $3 million there are 3.4 months of inventory. Above $15 million there are 56. That is the same city, the same product type and the same water, with a sixteen-fold difference in how long it takes the market to absorb what is listed.
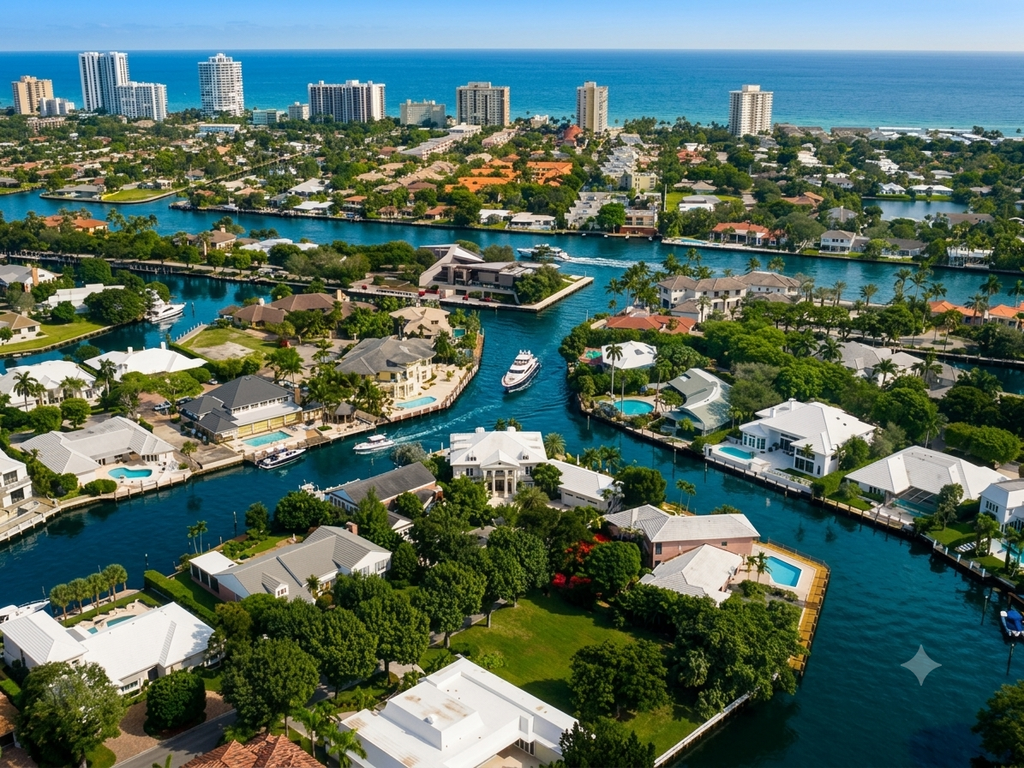
The second finding is about the word everyone uses. Of 344 Fort Lauderdale waterfront house closings since January 2025, three were on the ocean block. Three. The cheapest of those closed at $5,050,000. Below $5 million, not one ocean-block single-family house traded. In Fort Lauderdale, “waterfront” means a canal or the Intracoastal with a dock, and oceanfront is not a price tier so much as a rounding error.
I call the first finding the Liquidity Cliff. It runs the opposite direction to what most people assume about luxury, where more money is supposed to buy a faster, cleaner transaction.
The Liquidity Cliff
Months of inventory divides current active listings by the average monthly closing rate across the 21 months of this data.
| Price tier | Closings since Jan 2025 | Active listings now | Months of inventory |
|---|---|---|---|
| $1M to $3M | 134 | 22 | 3.4 |
| $3M to $5M | 91 | 20 | 4.6 |
| $5M to $8M | 71 | 33 | 9.8 |
| $8M to $15M | 36 | 39 | 22.8 |
| Above $15M | 12 | 32 | 56.0 |
Read the two middle columns against each other. Below $5 million, closings outnumber listings by six to one and four to one. Above $8 million that reverses: 39 listings against 36 closings in nearly two years, and above $15 million, 32 listings against 12 closings.
Three and a half months of supply is a seller’s market by any standard definition. Fifty-six months is not a market at all in the ordinary sense. It is a queue.
The outcomes follow the supply.
| Price tier | Closings | Median price | Median size | Median year built | Median $/SF | Median days to contract | Sold to list |
|---|---|---|---|---|---|---|---|
| $1M to $2M | 48 | $1,707,500 | 2,295 SF | 1965 | $717 | 56 | 92.0% |
| $2M to $3M | 86 | $2,400,000 | 2,498 SF | 1966 | $953 | 97 | 93.5% |
| $3M to $5M | 91 | $4,000,000 | 3,800 SF | 1986 | $1,091 | 86 | 93.8% |
| $5M to $8M | 71 | $5,975,000 | 5,510 SF | 2007 | $1,121 | 188 | 92.7% |
| $8M to $15M | 36 | $9,975,000 | 6,725 SF | 2019 | $1,514 | 179 | 92.2% |
| Above $15M | 12 | $23,152,500 | 10,274 SF | 2020 | $2,335 | 408 | 86.6% |
A house under $2 million went under contract in 56 days. A house above $15 million took 408, and gave up 86.6% of asking price. That is more than a year of carrying cost followed by a 13% concession.
The individual records at the top are worse than the median suggests. Among the twelve closings above $15 million, one took 1,862 days, one closed at 70% of its asking price and another at 72%. Two closed at 97%, so the tier is not uniformly punishing, but the spread is enormous and the downside is severe.
Three Ocean-Block Houses in 21 Months
This is the finding most likely to save a buyer a wasted trip.
| Address | Area | Closed price | Size | Year built |
|---|---|---|---|---|
| 3052 N Atlantic Boulevard | Lauderdale Beach | $26,000,000 | 10,289 SF | 2024 |
| 2920 N Atlantic Boulevard | Lauderdale Beach | $6,500,000 | 2,750 SF | 1951 |
| 1525 N Fort Lauderdale Beach Boulevard | Las Olas by the Sea | $5,050,000 | 3,938 SF | 2005 |
Three closings out of 344, which is 0.9% of the market. The entry point is $5,050,000 and the two genuinely oceanfront parcels on North Atlantic Boulevard went for $6,500,000 and $26,000,000. Listings are a separate question from closings, and there are more ocean-block houses asking than selling. That gap is the point. Scarce inventory that trades once or twice a year is not the same thing as an available market.
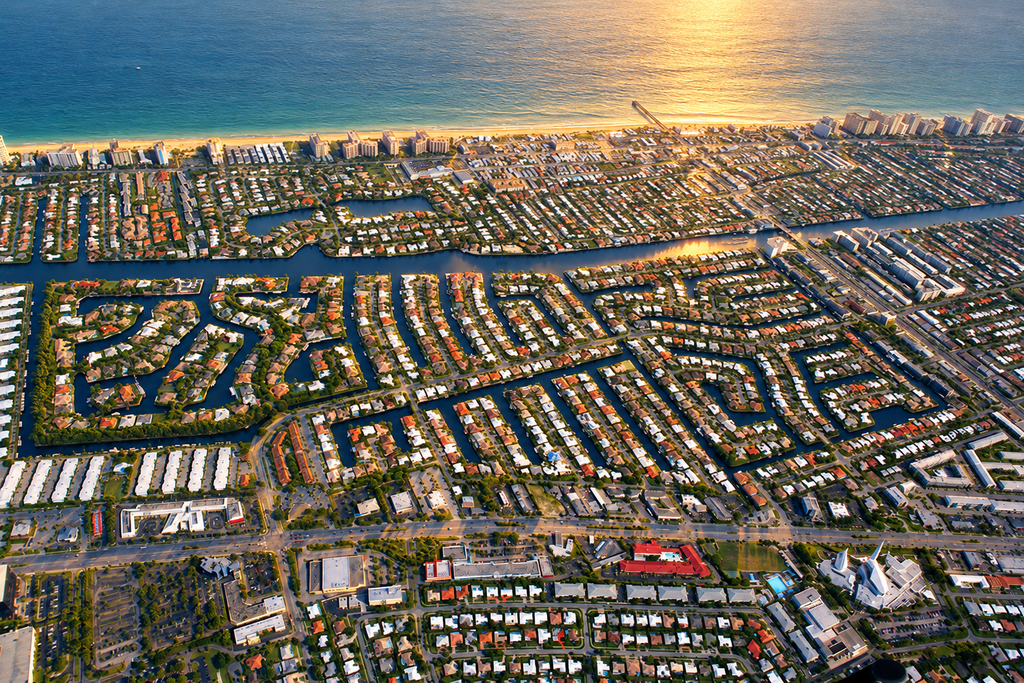
Everything else in those 344 sales is canal or Intracoastal. That is not a complaint about Fort Lauderdale, it is the structure of the city. The barrier island is narrow and most of its ocean frontage went to hotels and condominium towers decades ago. What Fort Lauderdale has in extraordinary depth is navigable canal, which is why it has more private dockage than anywhere else in the state.
For a buyer who wants the ocean and a house rather than an apartment, the practical answer in Fort Lauderdale is a canal house in a neighborhood with private beach access. Harbor Beach is the clearest version of that trade, with a dock behind the house and a neighborhood beach, and it recorded 18 closings in the period including one at $17,000,000.
In Fort Lauderdale, Money Buys New
Look at the median year built as you climb the price tiers: 1965, 1966, 1986, 2007, 2019, 2020. That is a clean monotonic ladder.
Grouped by vintage instead, across the 343 Fort Lauderdale closings that carry a year built, the same pattern holds.
| Year built | Closings | Median price | Median size | Median $/SF |
|---|---|---|---|---|
| Before 1960 | 61 | $2,850,000 | 2,514 SF | $1,138 |
| 1960s and 1970s | 114 | $2,300,000 | 2,618 SF | $892 |
| 1980s and 1990s | 46 | $4,297,500 | 4,249 SF | $1,047 |
| 2000 to 2014 | 49 | $5,400,000 | 5,760 SF | $993 |
| 2015 or later | 73 | $7,600,000 | 5,967 SF | $1,263 |
This is worth contrasting with Miami Beach, where I found the opposite pattern in condominiums. In New vs. Older Miami Luxury Condos, Miami Beach’s newer buildings read 19% below the older ones because the older towers hold the oceanfront positions. Fort Lauderdale’s waterfront houses have no such inversion. Here the newest product is both the largest and the most expensive per foot, because a canal lot is a canal lot and the house on it is most of what you are buying.
The pre-1960 row is the exception that proves the rule, at $1,138 per square foot against $892 for the 1960s and 1970s. Those are small houses on good lots, so a large land price divided by a modest structure produces a high rate. It is the same arithmetic I set out in Teardown or Turnkey, and it means price per square foot is the wrong metric on any Fort Lauderdale house you would consider replacing.
The Same House Costs Less Fifteen Minutes North
| City | Closings | Median price | Median $/SF | Median size | Median year built |
|---|---|---|---|---|---|
| Fort Lauderdale | 344 | $3,787,500 | $1,039 | 3,654 SF | 1978 |
| Lighthouse Point | 38 | $3,150,000 | $820 | 3,609 SF | 1995 |
| Pompano Beach | 126 | $1,825,000 | $854 | 2,145 SF | 1967 |
Lighthouse Point and Fort Lauderdale delivered almost identical houses. 3,609 square feet against 3,654. Lighthouse Point’s median closed $637,500 lower, and its stock is 17 years newer. On a rate basis that is $820 per square foot against $1,039, a discount of 21%.
What the Lighthouse Point buyer gives up is proximity, not water. Both have ocean access, Lighthouse Point through the Hillsboro Inlet. The trade is distance from Fort Lauderdale’s hospitals, airport, and the Las Olas restaurant corridor. For a buyer whose daily life does not depend on being ten minutes from downtown, it is the best value in this dataset.
Pompano Beach is the entry point at a $1,825,000 median, and it holds the only sub-$5 million ocean-block sales anywhere in this data, though both of those were co-operatives rather than fee-simple houses.
What This Means If You Are Buying
Above $8 million, you are the scarce party. Thirty-nine listings competing for the buyers behind 36 sales in 21 months. The median seller at that level waited 179 days and took 92.2%. Above $15 million the median waited 408 days and took 86.6%. Patience is worth more than it is anywhere else in this market, and a first offer in the mid-eighties as a percentage of asking is inside the observed range rather than outside it.
Below $3 million, move quickly and expect competition. At 3.4 months of inventory and 56 median days to contract in the lowest tier, this is the tight part of the market. The leverage you have above $8 million does not exist here.
If you want the ocean, decide whether you want it from a house or from a window. Three ocean-block houses closed in 21 months and the cheapest was $5,050,000. If that is the requirement, the budget follows from it. If what you actually want is to walk to the beach, a canal house with neighborhood beach access delivers it for a fraction, and Harbor Beach is where to look first.
Do not price an older canal house on rate. Pre-1960 houses show the highest price per square foot in the city at $1,138 and the second-lowest median price. The rate is an artifact of small houses on good land.
What This Means If You Are Selling
Know which side of the cliff you are on. A $2,400,000 canal house and a $9,975,000 canal house are not in the same market and should not be priced with the same confidence. One has 3.4 months of supply behind it. The other has 22.8.
Above $8 million, the first 90 days are not a test of the price. They are barely a sample. With 36 closings in 21 months across that whole tier, a listing can be correctly priced and still see very little traffic for a quarter. Judge the price against closings, not against showing counts.
Above $15 million, plan for a year and a concession. The median was 408 days at 86.6% of asking. Two of twelve closed at 97%, so a strong result is possible, but three of twelve closed at 84% or below. Build the floor into the plan before listing rather than discovering it in month fourteen.
Below $3 million, condition is the whole game. The stock is 1960s, buyers are comparing eight houses the same week, and the ones that clear in under 60 days are the ones that need nothing.
Frequently Asked Questions
How many months of inventory does Fort Lauderdale waterfront have?
It depends entirely on price. Between $1 million and $3 million, 3.4 months. Between $3 million and $5 million, 4.6. Between $5 million and $8 million, 9.8. Between $8 million and $15 million, 22.8. Above $15 million, 56.0. That is based on 344 closings since January 2025 and 146 current active listings.
Are there oceanfront single-family homes in Fort Lauderdale?
Very few. Three of 344 waterfront house closings since January 2025 were on an ocean block, which is 0.9%. They closed at $5,050,000, $6,500,000 and $26,000,000. No ocean-block single-family house closed below $5 million. Fort Lauderdale’s waterfront housing stock is overwhelmingly canal and Intracoastal with private dockage.
What does $2 million buy on the Fort Lauderdale waterfront?
About 2,300 to 2,500 square feet, built in the mid-1960s, on a canal with a dock. The $1 million to $2 million tier had a median of 2,295 square feet at $717 per square foot and a median year built of 1965. The $2 million to $3 million tier had 2,498 square feet at $953 and a median year built of 1966.
How long does a Fort Lauderdale waterfront house take to sell?
From 56 days to 408 days depending on price. Under $2 million, a median of 56 days. Between $2 million and $5 million, 86 to 97 days. Between $5 million and $15 million, 179 to 188 days. Above $15 million, 408 days.
How much do Fort Lauderdale waterfront sellers discount?
Median sold to list ran from 86.6% above $15 million to 93.8% between $3 million and $5 million. The pattern is not linear with price, it is worst at the top where inventory is deepest. Note that these use the list price on the closed record, which is often already a reduced price, so the discount from the original asking price is larger.
Is Lighthouse Point cheaper than Fort Lauderdale?
For the same size house, yes, by about 21% on a rate basis. Lighthouse Point’s 38 closings had a median of $3,150,000 at $820 per square foot for 3,609 square feet, against Fort Lauderdale’s $3,787,500 at $1,039 for 3,654 square feet. Lighthouse Point’s stock is also newer, with a median year built of 1995 against 1978.
Does new construction cost more on the Fort Lauderdale waterfront?
Yes, and that is different from Miami Beach condominiums. Houses built in 2015 or later had a median of $7,600,000 at $1,263 per square foot. Houses from the 1960s and 1970s had a median of $2,300,000 at $892. Median year built climbs steadily with every price tier, from 1965 under $2 million to 2020 above $15 million.
Why is price per square foot highest on the oldest Fort Lauderdale houses?
Because the measurement divides by the house. Pre-1960 waterfront houses show $1,138 per square foot, the highest in the city, at a median size of 2,514 square feet and a median price of $2,850,000, which is below the city median. A buyer paying for a good canal lot and dividing by a small structure produces a high rate. On any house you would consider replacing, price the land instead.
Buying or Selling a Fort Lauderdale Waterfront Home?
What a waterfront house is worth here cannot be reduced to the city name or an average price per square foot. It depends on canal width and whether it is a dead end or a through route, the distance and bridge clearances to the inlet, seawall condition and cap height, lot orientation and afternoon sun on the dock, whether the structure has any value to you or is a teardown, and how many comparable houses are listed on your own water right now.
If you’re evaluating a property in Las Olas Isles, Seven Isles, Nurmi Isles, Sunrise Key, Idlewyld, Rio Vista, Harbor Beach, Coral Ridge, Coral Ridge Country Club, The Landings, Bermuda Riviera, Lauderdale Beach, Isla Bahia, Pelican Isle or Lighthouse Point, contact Ashton Coleman for a property-specific comparison using recent closed sales and current competing inventory.
Explore current listings on Miami Penthouses & Estates.
📞 305.978.7704
📧 AColeman@onesothebysrealty.com

About the Market Data
This analysis combines two Southeast Florida MLS (SEFMLS) exports of waterfront single-family sales in the Fort Lauderdale coastal corridor, one covering $1,000,000 to $5,000,000 and one covering $5,000,000 and above, both from January 2025 through early October 2026, a span of 21 months. Together they hold 518 usable closings and 146 current Fort Lauderdale active listings. Fort Lauderdale accounts for 344 of the closings, Pompano Beach 126, Lighthouse Point 38 and Hillsboro Beach 4. Six closings could not be assigned to a city and are excluded from the city table. Two records with implausible sale prices, one at $1,000 and one at $9,250, are excluded entirely.
The vintage table rests on 343 of the 344 Fort Lauderdale closings, because one record carries no year built. City is assigned from the subdivision name, with the MLS area code used where the subdivision was ambiguous. The exports cover a corridor rather than a municipal boundary, so Pompano Beach and Lighthouse Point appear alongside Fort Lauderdale. Anyone comparing these figures to a city-limits report will find differences for that reason.
The ocean-block test is based on street name, identifying North and South Atlantic Boulevard, Fort Lauderdale Beach Boulevard, El Mar Drive and Ocean Boulevard. Those roads have houses on both sides in places, so the test may count a house across the street from the sand as ocean-block, which means three is an upper bound rather than a lower one. It is a proxy for an oceanfront field this export does not contain.
Months of inventory divides current active listings by the average monthly closing rate over the 21 months of closed data. It assumes the forward absorption rate matches the trailing one, which it will not exactly, and the top two tiers rest on 36 and 12 closings so their figures are the least stable in the post. The above-$15M tier holds 12 closings and should be read as a description of those twelve sales rather than as a benchmark.
Sold to list uses the list price on the closed record, which is frequently a reduced price rather than the original asking price, so every sold-to-list figure here understates the true discount. Days on market is cumulative days on market to contract, which can reset when a listing is withdrawn and relisted. One closing reports zero square feet and is excluded from rate calculations.
Three fields that matter enormously on a waterfront house are absent from these exports: lot size, water frontage width, and number of stories. Nothing in this analysis accounts for any of them, and on a canal all three can move value more than anything in the tables above. Year built is the MLS field and does not capture renovations, so a 1958 house rebuilt in 2022 is counted as a 1958 house. MLS information is believed accurate but is not guaranteed.
Disclaimer
Information is provided for informational purposes only and is subject to change without notice. Real estate statistics, listings and sales information should be independently verified. Nothing contained herein constitutes legal, tax, financial or investment advice. Buyers and sellers should consult appropriate professional advisors before making real estate decisions.