


When I published the Hollywood Beach real estate guide in late June, the data told a specific story: a buyer’s market with 12.8 months of inventory in the 33019 coastal condo segment, softening price-per-square-foot year-over-year, and extended days on market. That guide covered what the data honestly showed — and I said so.
This is the Q3 2026 update for the broader City of Hollywood real estate market — and it tells a meaningfully different story. Not because anything was wrong with the June analysis, but because two things have changed: one month of additional data, and the scope of the data itself.
This report covers all residential property types — single-family homes and condos combined — across the full City of Hollywood, all price ranges, published July 2026 from TrendGraphix MLS sources. It is broader than the coastal 33019 condo-specific pull that anchored the June guide, and that breadth produces a different picture. I’ll explain the difference explicitly so you can read both reports with full context.
The Scope Difference: What This Data Actually Covers
Before any market figures, the most important thing to establish is what this data set is and what it is not.
This TrendGraphix report covers all residential properties — single-family homes and condos — across the entire City of Hollywood, at all price points. It includes properties in Hollywood Hills, Emerald Hills, West Hollywood, and every other neighborhood in the municipality alongside the Hollywood Beach coastal corridor.
The June 2026 Hollywood Beach guide used a 33019-only, condo-and-townhome-specific pull. That report was the right instrument for a guide about Hollywood Beach’s coastal condo market specifically — the segment where ICON Beach and the Broadwalk-adjacent towers compete directly with each other and with Hallandale Beach’s condo inventory.
This report is the right instrument for understanding Hollywood’s real estate market as a whole — including the single-family neighborhoods that represent a substantial share of overall transaction volume and that often perform differently from the coastal condo strip on key metrics like days on market, months of inventory, and price appreciation.
Both reports are accurate. They describe different segments of the same city. Readers who are evaluating a coastal condo should read both. Readers evaluating a Hollywood Hills or Emerald Hills single-family home should focus on this report.
Data sourced from TrendGraphix Facts and Trends reports based on Southeast Florida MLS records, City of Hollywood, all residential property types, all price ranges, published July 2026 and reflecting data through July 27, 2026.
Inventory: The Most Important Number Has Changed Significantly
The headline figure in this data that would surprise most buyers and sellers who formed their view of the Hollywood market in late 2025 or early 2026 is the months-of-inventory figure — and it has moved dramatically.
Months of inventory based on closed sales in June 2026 was 7.4 — down 15.9% from May’s 8.8 and down 43.8% from June 2025’s 13.2. The 15-month chart is unambiguous: inventory peaked at 13.2 months in both June 2025 and January 2026, then compressed sharply, reaching 7.4 in June 2026 — the lowest reading in the 15-month window. The early July 2026 figure of 10.4 months reflects the typical end-of-month pattern where lower closings in the first half of the month temporarily inflate the months-of-inventory calculation.
Seven-point-four months is still technically a buyer’s market by the conventional 6-month threshold — but it is 1.4 months from neutral, and it represents nearly a 6-month improvement in inventory conditions over a twelve-month period. That rate of compression, sustained over a full year, is the defining market story for the City of Hollywood in Q3 2026.
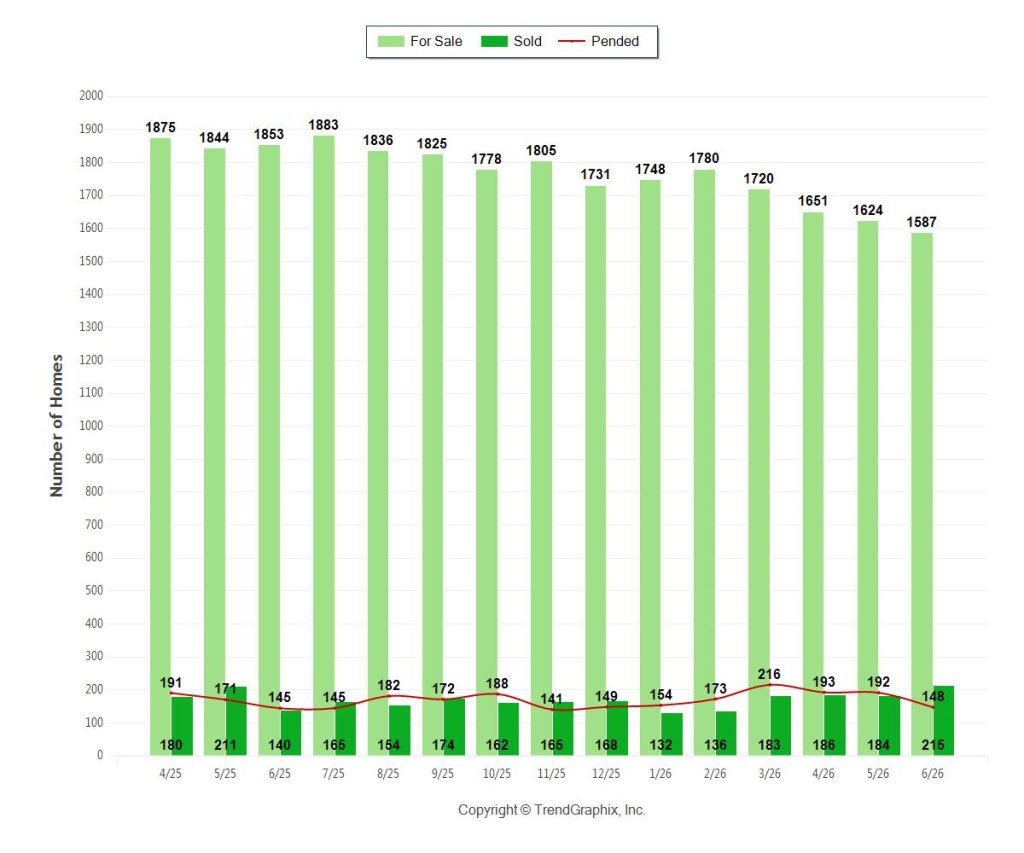
Active listings in June stood at 1,587 — down 2.3% from May and down 14.4% from June 2025’s 1,853. The 15-month chart shows a consistent downward trend from the 1,875 peak in April 2025 to 1,587 in June 2026 — a 15.4% decline from peak over 14 months. The early July figure of 1,518 continues that trend.
For sellers in Hollywood: the inventory conditions that characterized this market eighteen months ago — when 13+ months of supply gave buyers exceptional leverage — have substantially normalized. The market is still a buyer’s market by the numbers, but it is approaching neutral faster than the general perception of Hollywood as a soft market would suggest.
Sales Volume: The Strongest Signal
Sales volume is where Hollywood’s Q3 2026 data diverges most sharply from the narrative most buyers and sellers carry about this market.
June 2026 produced 215 closings — up 16.8% from May and up 53.6% from June 2025’s 140. That year-over-year comparison is extraordinary — nearly 54% more closings in June 2026 than June 2025 across the full City of Hollywood.
The trailing-quarter context confirms this is a real trend rather than a single-month spike. April through June 2026 produced 585 closings, versus 531 in the same quarter of 2025 — up 10.2% year-over-year. The YTD figure is equally positive: 1,176 closings year-to-date versus 1,104 through the same period last year — up 6.5%.
This is a meaningfully different picture from Sunny Isles Beach’s luxury condo segment, where YTD closings were running 6.8% below last year, or the 33019 condo-specific pull where YTD closings were similarly soft. The broader City of Hollywood — with its mix of single-family homes, condos, and all price points — is transacting at a higher volume than a year ago. That is an unambiguous positive signal.
Pending sales of 148 in June — up 2.1% YoY — and YTD pending volume of 1,271 versus 1,171 last year, up 8.5%, confirm that the forward pipeline is also running ahead of last year. Unlike Sunny Isles Beach where pendings were trailing last year’s pace by 8.3%, Hollywood’s forward pipeline is building momentum.
Pricing: Modest But Consistent Appreciation
Hollywood’s pricing picture in Q3 2026 is the most straightforward of any market covered in the MLS-sourced report series so far: modest, consistent appreciation across all metrics, no dramatic swings in either direction.
Average sold price per square foot: $390 in June 2026, up 3.2% from May and up 5.4% from June 2025’s $370. YTD average of $385, up 2.1% from last year’s $377. The 15-month chart shows a range of $362 to $419, with June’s $390 sitting in the upper-middle of that range — not a spike, not a decline, a consistent mid-range reading.
Average sold price: $582,000 in June 2026, up 1.7% from May and up 9% from June 2025’s $534,000. YTD average of $567,000, up 4.2% from $544,000 the prior year. The 15-month chart shows the average sold price in a narrow band between $534,000 and $626,000 — a $92,000 range across fifteen months, reflecting a market without the extreme volatility seen in Sunny Isles Beach’s luxury segment or the thin-market swings of Fisher Island and Golden Beach.
Average active listing price: $677,000 in June 2026, down 1.2% from May and down 3% YoY. The gap between average asking price of $677,000 and average sold price of $582,000 is approximately $95,000 — a 14% discount from asking to close. That gap has been stable across the 15-month window and reflects the market’s consistent pattern: sellers are asking optimistically, buyers are transacting realistically, and the 92% sold-to-original-list ratio captures the discipline of the specific transactions that actually close.
The honest summary: Hollywood’s pricing is appreciating modestly — 2% to 5% depending on which metric and which period you measure — in a market where inventory is contracting, and volume is growing. That combination of modest appreciation, contracting inventory, and growing volume is the signature of a market in genuine recovery rather than a market making noise around a flat trend.
Days on Market: The One Lagging Indicator
The one figure in this data that runs contrary to the improving market picture is days on market — and it is worth honest treatment rather than minimizing.
June 2026 average days on market was 86 — up 10.3% from May’s 78 and up 7.5% from June 2025’s 80. The YTD average of 87 days is up 14.5% from last year’s 76 days. Homes in the City of Hollywood are taking meaningfully longer to sell in 2026 than they did in 2025 — roughly 11 additional days on a YTD basis.
The 15-month chart provides context: the days-on-market trend peaked at 112 days in January 2026 — the same month when inventory also peaked at 13.1 months — and has been declining since, reaching 86 days in June 2026. The YTD average is elevated relative to last year because January’s 112-day peak is dragging the full-year average upward. The trajectory is improving; the absolute level is still above last year’s pace.
The sold-to-original-list ratio of 92% in June 2026 — up 2.2% YoY — is the counterweight to the days-on-market figure. Sellers who price accurately are getting 92 cents on their original asking dollar and are closing in approximately 86 days. Sellers who don’t price accurately are contributing to the extended days-on-market average that their accurately-priced neighbors experience as a statistical consequence of the same listing database.
Hollywood vs. Sunny Isles Beach: What the Comparison Tells You
This is the first time in this MLS report series where two adjacent markets can be compared directly using the same data source and the same reporting period, so it is worth making the comparison explicit.
Months of inventory: Hollywood 7.4 versus Sunny Isles Beach (luxury condo, $1M+) 13.9. Hollywood is materially closer to neutral market conditions.
YTD sales volume: Hollywood up 6.5% versus Sunny Isles Beach down 6.8%. Hollywood is growing; Sunny Isles Beach is contracting on a YTD basis.
Average sold price per square foot: Hollywood $385 YTD versus Sunny Isles Beach $1,193 YTD. The price point difference reflects both the different market segments (all-price Hollywood vs. $1M+ SIB) and the genuine price premium of the Sunny Isles Beach oceanfront branded building corridor.
Days on market: Hollywood 87 days YTD versus Sunny Isles Beach 143 days YTD. Hollywood is selling significantly faster.
Sold-to-list ratio: Hollywood 92% versus Sunny Isles Beach 90%. Both markets are within 2 points of each other, reflecting comparable pricing discipline among sellers who are transacting.
The takeaway: Hollywood offers a more accessible, faster-moving, closer-to-neutral market than the Sunny Isles Beach luxury condo segment, at a dramatically lower price point. For buyers who are price-sensitive or timeline-sensitive, Hollywood’s current conditions are genuinely more favorable than its luxury neighbor to the north on every absorption metric other than absolute pricing.
What I Am Telling Buyers and Sellers Right Now
For buyers in Hollywood:
The inventory window you had at 13+ months in late 2025 and early 2026 is closing. Not closed — 7.4 months is still a buyer’s market — but the trajectory is clearly toward neutral, and the pace of compression over the past twelve months has been among the fastest of any South Florida market in this report series. Buyers who have been waiting for further price declines should weigh the 43.8% improvement in inventory conditions against the additional leverage they are waiting for. Markets that compress from 13 months to 7 months in twelve months do not typically revert to 13 months without a significant external catalyst.
For buyers specifically evaluating coastal condos in the 33019 zip code, the June Hollywood Beach guide with its 33019-specific condo data remains the right reference for that segment. This report’s 7.4-month figure reflects the broader city market; the coastal condo strip’s condition is documented separately and is softer on a per-square-foot basis.
For sellers in Hollywood:
The days-on-market figures — 87 days YTD, up 14.5% from last year — remain the most important calibration tool for sellers’ timeline expectations. The market is not moving as quickly as it did in 2024 and early 2025. But the 92% sold-to-original-list ratio confirms that sellers who price accurately relative to current comparables are closing within that timeframe. Sellers anchored to asking prices from the 2024 peak cycle are experiencing the difference between 86 days and 6 months as a direct consequence of that misalignment.
With the spring season behind us and the August seasonal slowdown approaching, sellers who have not yet sold should make pricing decisions before August rather than after — the market window from September through November is the next viable selling window, and entering it well-priced is meaningfully better than entering it with a price reduction in the recent listing history.
Frequently Asked Questions
Is Hollywood, Florida a buyer’s or seller’s market in Q3 2026?
Technically still a buyer’s market at 7.4 months of inventory — above the 6-month neutral threshold — but approaching neutral faster than any other South Florida market in this report series. Down from 13.2 months a year ago, Hollywood’s inventory conditions have normalized significantly and are approaching balance.
What is the average home price in Hollywood, Florida in 2026?
The average sold price in June 2026 was $582,000, up 9% year-over-year. The YTD average is $567,000, up 4.2% from the prior year. Average active listing price is $677,000, reflecting the typical gap between asking and transaction pricing.
What is the average price per square foot in Hollywood, FL?
June 2026 average sold price per square foot was $390, up 5.4% year-over-year. The YTD average is $385, up 2.1% from the prior year. Both figures reflect the full City of Hollywood across all property types and price points.
How long does it take to sell a home in Hollywood, Florida?
Average days on market is 87 days year-to-date — up 14.5% from last year’s 76-day average. June 2026’s reading of 86 days is an improvement from the 112-day peak in January 2026. Sellers who price accurately are transacting at a 92% sold-to-original-list ratio within this timeframe.
How is Hollywood’s market different from Sunny Isles Beach?
Hollywood’s full-market data shows 7.4 months of inventory versus Sunny Isles Beach’s luxury condo segment at 13.9 months. Hollywood’s YTD sales volume is up 6.5% versus Sunny Isles Beach’s luxury segment down 6.8%. Hollywood’s average sold price of $582,000 is substantially below Sunny Isles Beach’s $2,984,000 YTD average, reflecting both the different price segments covered and the genuine premium of the oceanfront branded tower corridor.
How does this report differ from the June 2026 Hollywood Beach guide?
The June guide used 33019 zip-code-specific, condo-and-townhome-only data — the instrument best suited for evaluating Hollywood Beach’s coastal condo market. This Q3 report uses city-wide, all-property-type data — the instrument best suited for understanding Hollywood’s overall residential market. Both reports are accurate for their respective scopes. Buyers and sellers evaluating coastal condos should read both; those evaluating single-family homes in Hollywood Hills, Emerald Hills, or other neighborhoods should rely primarily on this report.
Ready to Act in Hollywood?
Hollywood’s market in Q3 2026 has moved faster than most buyers and sellers who formed their view in late 2025 are accounting for. The market is still a buyer’s market — but it is 1.4 months from neutral, coming from 13+ months of supply twelve months ago. That trajectory matters as much as the current reading.
I am Ashton Coleman, a Broker-Associate with ONE Sotheby’s International Realty, holding the Certified Luxury Home Marketing Specialist (CLHMS) Million Dollar Guild designation, Certified Negotiation Expert (CNE), Transnational Referral Certification (TRC), and Resort & Second-Home Property Specialist (RSPS) designations. I represent buyers and sellers across Hollywood and the broader Broward County market.
View all available Hollywood real estate at MiamiPenthousesandEstates.com, or contact me directly for a personalized market analysis specific to your property or target submarket.
📞 Call or text: 305.978.7704
📧 Email: AColeman@onesothebysrealty.com
🌐 Search Hollywood real estate: MiamiPenthousesandEstates.com
Market data in this report is sourced from TrendGraphix Facts and Trends reports based on Southeast Florida MLS records, covering all residential property types in the City of Hollywood across all price ranges, published July 2026 and reflecting data through July 27, 2026. This report covers the full City of Hollywood, not the 33019 zip code specifically — see the June 2026 Hollywood Beach guide for 33019 coastal condo-specific data. All figures are subject to change. This report is for informational purposes only and does not constitute financial, legal, or investment advice. Verify all data with your legal and financial advisors prior to entering any transaction.