


Halfway through 2026, the Miami-Dade luxury real estate market is telling three different stories depending on which altitude you’re looking at. The countywide numbers show a market still working through inventory. The $1 million-and-above coastal corridor shows price appreciation accelerating even as transactions take longer to close. The $10 million-and-above ultra-luxury tier shows a market so thin that a handful of closings can swing the headline statistics by 600% in a single month.
This is not a contradiction. It is what a genuinely bifurcated market looks like when you pull the data by tier instead of relying on a single blended county average — which is exactly what most market commentary does, and exactly why it tends to mislead both buyers and sellers at the high end.
This outlook is built directly from MLS-sourced TrendGraphix data — not web-aggregated listing pages, not press releases, not developer marketing copy. Three pulls: Miami-Dade County overall, the core coastal luxury corridor at $1 million and above, and that same corridor at $10 million and above. Here is what the first half of 2026 actually shows, and what it means for the second half.
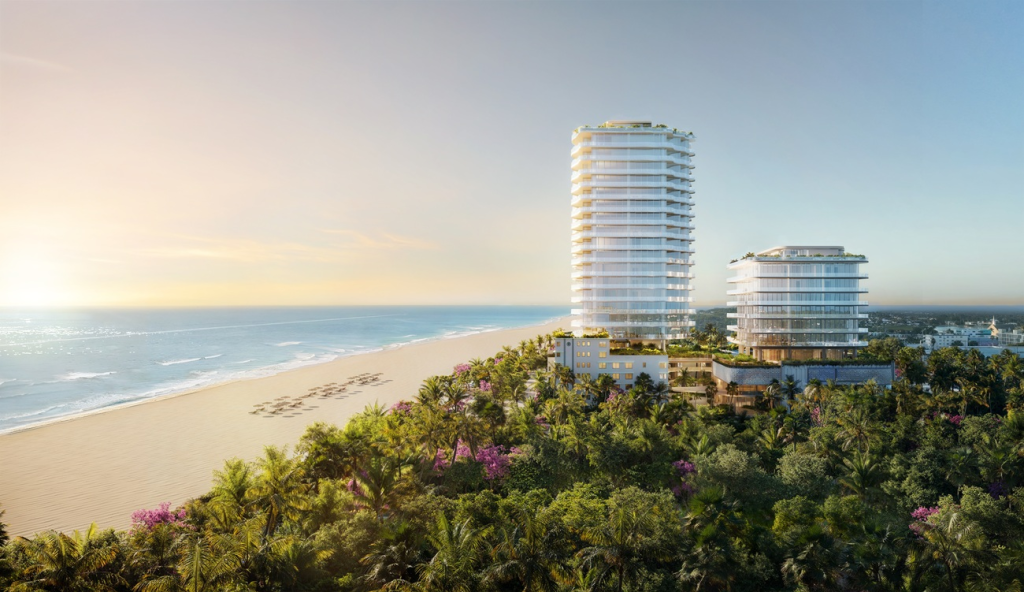
The County-Wide Picture: A Market Still Absorbing Inventory
Miami-Dade County as a whole — all properties, all price points, single-family homes and condos combined — is showing a market that has cooled from its 2021-2022 peak but continues to appreciate on a price-per-square-foot basis even as transaction volume softens.
As of mid-June 2026, there are 16,477 active listings across the county — down 16.4% from the same period a year ago and down 1.6% from the prior month. That declining active inventory, combined with softening sales volume, is the kind of data point that gets reported as contradictory but is actually consistent: fewer new listings are coming to market, and the listings that do come to market are taking longer to find buyers.
Year-to-date sales through mid-June total 10,574 closings — up a modest 2% from the same period last year. Pending sales are up 5.9% year-to-date at 12,055. Those are not dramatic figures in either direction. They describe a market that is neither accelerating nor stalling — it is finding its footing after two years of more pronounced softening from the 2021-2022 frenzy.
The price data tells the more interesting half of the story. The countywide average sold price per square foot is $711 — up 33.6% compared to the same period a year ago, and up 1.3% from the prior month. The average sold price is $1,242,000, up 41.9% year-over-year. Average days on market sits at 85, up from 78 a year ago. The Sold-to-Original-List-Price ratio is 91%, essentially flat year-over-year.
Read together, these numbers describe a market where prices are rising meaningfully even as the pace of transactions extends modestly. That is not the signature of a market correcting. It is the signature of a market where sellers who price accurately are still being rewarded, while overall transaction velocity is normalizing from the unsustainable pace of 2021 and 2022.
The $1 Million-and-Above Coastal Corridor: Where the Outlook Actually Lives
For the luxury buyers and sellers this outlook is written for, the countywide blended number is context — the market that actually matters is the $1 million-and-above tier across Miami-Dade’s core coastal luxury corridor: Aventura, Bal Harbour, Bay Harbor Islands, Coconut Grove, Coral Gables, Eastern Shores, Fisher Island, Golden Beach, Miami Beach, Miami Shores, North Bay Village, Sunny Isles Beach, and Surfside.
This is meaningfully different data from the countywide figures, and the difference is the entire point. At $1 million and above across this corridor, there are 1,938 active listings as of mid-June — down 18.6% from a year ago. Year-to-date sales total 1,021, up 12.2% from the same period last year. Pending sales are up 13.9% at 1,179.
The pricing data is where this tier separates itself decisively from the broader county. The average sold price per square foot across this $1 million-plus corridor is $1,688 — up 51% compared to the same period a year ago, and the year-to-date average sits at $1,557, up 9.4% from last year. The average sold price is $5,303,000, up an extraordinary 93% from the same period a year ago, though the year-to-date average of $4,402,000 — up a more sustainable 12.2% — is the more reliable figure given how dramatically a handful of large transactions can swing a single-period average at this tier.
Average days on market for this corridor sits at 109 — down 11.4% from the same period a year ago, but the year-to-date figure of 123 is actually up 7.9% from last year. That combination — a recent-period improvement against a year-to-date figure that is still elevated versus last year — suggests a market that struggled through the first part of 2026 but has been accelerating into the early summer. The Sold-to-Original-List-Price ratio is 91%, up nearly six points from a year ago, which is a meaningful signal: sellers in this tier are getting closer to their original asking price than they were twelve months ago, even as overall days-on-market figures remain elevated relative to last year.
The honest read for buyers and sellers in this $1 million-plus tier: this is a market where well-priced inventory is moving with increasing efficiency, where price-per-square-foot appreciation has been substantial over the past twelve months, and where the gap between what sellers ask and what buyers pay has been narrowing. That is a seller-favorable trend wrapped inside a market that, on raw day-count, still looks slower than it did a year ago — the kind of nuance that a single headline statistic cannot capture.

The $10 Million-and-Above Ultra-Luxury Tier: Small Numbers, Real Signal
At $10 million and above across the same coastal corridor, the market becomes thin enough that every individual transaction carries outsized statistical weight, which is itself the most important thing to understand before reading any of these figures.
There are 215 active listings at $10 million-plus as of mid-June — down 13.7% from a year ago. Year-to-date sales total 101 closings, up 71.2% from the same period last year — a dramatic-sounding figure that reflects a market moving from a genuinely slow base period rather than a structural surge. Pending sales are up 63.2% at 142, continuing that same low-base effect.
The month-to-date sold figure illustrates this volatility precisely: 14 closings this period versus 2 closings in the same period last year is mathematically a 600% increase, and it is also a comparison of two very small numbers. The headline percentage is real, but the underlying signal is simply that the ultra-luxury tier saw more transactions close in a two-week window this year than last — not that demand has sextupled.
The pricing data at this tier requires the same careful reading. Average sold price per square foot is $2,977 month-to-date, up 25.3% year-over-year, with the year-to-date average at $3,212 — up a more modest 4.7%. Average sold price is $16,992,000 month-to-date, up 35.9% — though the year-to-date average sold price of $18,679,000 is actually down 11% from last year, reflecting how dramatically the mix of which specific properties close in any given window can swing the average at this rarefied tier.
Days on market at this level tells perhaps the most important story for sellers: the month-to-date figure of 71 days looks fast, but the year-to-date average of 185 days — up nearly 50% from last year — and the quarterly figure of 203 days, up 62.4% from the prior quarter, both point to a market where $10 million-plus properties are taking meaningfully longer to find buyers than they did twelve months ago. The Sold-to-Original-List-Price ratio of 90% year-to-date, up from 87% last year, suggests that the properties that do sell are closing closer to their original ask, but the extended marketing time required to get there is the dominant trend at this tier in the first half of 2026.
For sellers with $10 million-plus listings, the practical takeaway is straightforward: expect a longer marketing process than the headlines about luxury market strength suggest, price with discipline from day one, and treat any single month’s transaction count as noise rather than a signal in a market this thin.
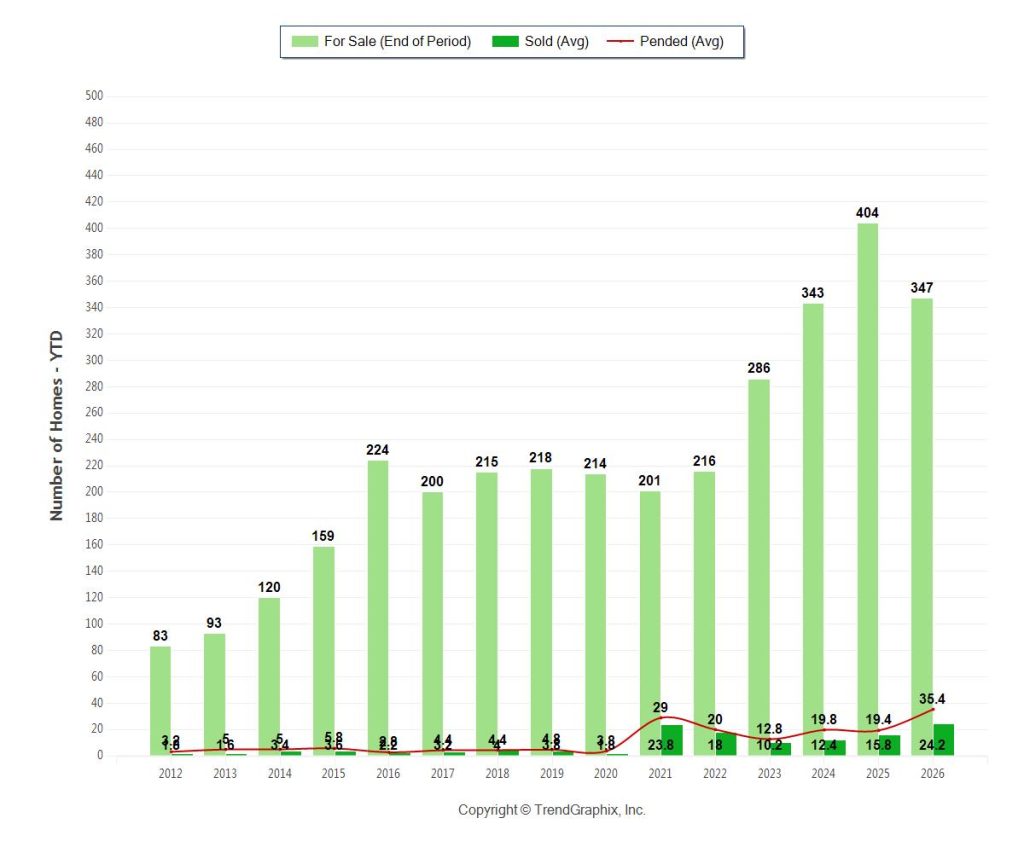
The Three-Tier Comparison: What Changes as You Move Up the Market
Looking at all three data sets side by side reveals the shape of Miami-Dade’s bifurcation more clearly than any single report can.
Days on market increases as price tier rises — 85 days countywide, 109 to 123 days at the $1 million-plus tier, and 185 to 203 days at the $10 million-plus tier. That progression is intuitive but worth stating plainly: the higher the price point, the more patient both buyer and seller need to be, and the more dangerous it is to read a fast headline statistic as representative of the broader trend at that tier.
Price-per-square-foot appreciation is strongest at the $1 million-plus tier — 51% month-to-date, 9.4% year-to-date — outpacing both the countywide figure and the $10 million-plus tier on a year-to-date basis. This is an important and somewhat counterintuitive finding: the most dramatic price appreciation in Miami-Dade’s first half of 2026 is happening in the upper-middle luxury tier, not at the very top of the market. Buyers who assumed the ultra-luxury tier was where the fastest appreciation lives should recalibrate that assumption based on this data.
The Sold-to-Original-List-Price ratio is highest at the $1 million-plus tier (91%) and the $10 million-plus tier (90% year-to-date), both ahead of the countywide figure (91% — essentially identical to the $1 million tier). This tells us that pricing discipline among sellers and informed expectations among buyers are roughly consistent across price tiers in 2026 — there is no evidence in this data that luxury sellers are dramatically overreaching relative to the broader market.
Active inventory is down meaningfully across every tier compared to a year ago — 16.4% countywide, 18.6% at $1 million-plus, 13.7% at $10 million-plus. Declining inventory across every price band, combined with rising prices at the middle and upper-middle luxury tiers, is the clearest single signal in this data set: Miami-Dade’s luxury market in the first half of 2026 is not oversupplied, and the properties that are available are commanding higher prices per square foot than they were a year ago.
What This Means for the Second Half of 2026
For buyers across every tier, the data argues against waiting for a meaningful price correction. Inventory is contracting, not expanding, across the county and across every luxury price band. Price-per-square-foot is appreciating at every tier examined in this report. The historical pattern in Miami-Dade’s luxury market has been that buyers who wait for softer pricing in a contracting-inventory environment typically end up paying more, not less, by the time they act.
For sellers in the $1 million-to-$10 million range, the second half of 2026 presents the most favorable conditions documented in this report: a 91% sold-to-original-list ratio, accelerating price-per-square-foot appreciation, and a days-on-market trend that improved meaningfully in the most recent period compared to the year-to-date average. Pricing accurately and presenting well should produce a faster, cleaner transaction than this same seller would have experienced twelve months ago.
For sellers above $10 million, the second half of 2026 requires patience and pricing discipline rather than urgency. The 185-to-203-day marketing timeline documented in this tier is the realistic expectation, not the exception. Sellers who price aspirationally at this level, hoping to attract a buyer quickly, are working against a market that has consistently required more time at this price point throughout 2026.
For investors evaluating Miami-Dade broadly, the most actionable finding in this report is the divergence between the $1 million-plus tier’s price appreciation and the countywide average. The upper-middle luxury corridor — the $1 million to roughly $5 million range across Aventura, Bal Harbour, Bay Harbor Islands, Sunny Isles Beach, Surfside, and the other coastal communities in this data set — is appreciating faster on a price-per-square-foot basis than either the broader county or the ultra-luxury tier above it. That is where the most measurable momentum in Miami-Dade’s luxury market currently sits.
A Note on This Data
This outlook is built from three TrendGraphix Facts and Trends reports sourced from the Southeast Florida MLS, the Realtor Association of Miami, and related regional MLS data, published June 2026 and reflecting data through mid-June 2026. The county-wide figures cover all of Miami-Dade County across all property types and price points. The $1 million-plus and $10 million-plus figures are scoped specifically to the coastal corridor spanning Aventura, Bal Harbour, Bay Harbor Islands, Coconut Grove, Coral Gables, Eastern Shores, Fisher Island, Golden Beach, Miami Beach, Miami Shores, North Bay Village, Sunny Isles Beach, and Surfside — not all of Miami-Dade County at those price tiers, and not isolated to any single neighborhood within that corridor. Readers evaluating a specific building or submarket should request data scoped to that specific area, as blended multi-area figures, however accurate, cannot be attributed to any single community within the data set.
Frequently Asked Questions
Is Miami-Dade a buyer’s or seller’s market in mid-2026?
By the conventional months-of-inventory standard, both May 2026 quarterly readings in this data set were classified as buyer’s markets at the countywide and $1 million-plus tiers. However, the underlying price-per-square-foot and sold-to-list-price data suggest sellers who price accurately are achieving strong outcomes — particularly at the $1 million-plus tier, where the sold-to-original-list ratio reached 91%.
What is the average price per square foot in Miami-Dade in 2026?
Countywide across all property types and price points, the average sold price per square foot is $711, up 33.6% year-over-year. At the $1 million-plus tier across Miami-Dade’s core coastal luxury corridor, the average is $1,688, up 51% over the same period. At $10 million-plus, the average is $2,977, up 25.3%.
How long does it take to sell a luxury home in Miami-Dade?
Average days on market varies significantly by price tier: 85 days countywide, 109 to 123 days at the $1 million-plus coastal luxury tier, and 185 to 203 days at the $10 million-plus ultra-luxury tier. Higher price points require meaningfully more patience from both buyers and sellers.
Is the Miami ultra-luxury market ($10M+) slowing down in 2026?
The data shows a mixed picture. Transaction counts are up substantially year-to-date, but that reflects a low base period rather than a dramatic demand surge. Days on market increased significantly — the year-to-date average of 185 days is up nearly 50% from the prior year, indicating that $10 million-plus properties are taking longer to sell, even as the properties that do sell are closing closer to their original list price.
Which Miami-Dade luxury price tier is appreciating fastest in 2026?
The $1 million-plus tier across Miami-Dade’s core coastal luxury corridor is showing the strongest price-per-square-foot appreciation in this report — 51% month-to-date and 9.4% year-to-date — outpacing both the broader countywide market and the $10 million-plus ultra-luxury tier on a year-to-date basis.
Should I wait to buy in Miami-Dade in the second half of 2026?
The data argues against waiting for a meaningful correction. Active inventory has declined across every price tier compared to a year ago — 16.4% countywide, 18.6% at the $1 million-plus tier, and 13.7% at the $10 million-plus tier — while price-per-square-foot is appreciating at every tier. Contracting inventory combined with rising prices is historically not the environment in which buyers benefit from waiting.
Ready to Discuss Your Specific Market Position?
This outlook is built on real MLS data, but real estate decisions are made at the level of a specific building, a specific neighborhood, and a specific property — not a blended county average. If you are evaluating a purchase or sale anywhere in Miami-Dade’s luxury market, I can pull data scoped specifically to your building or submarket and give you the same level of rigor this report applies countywide.
I am Ashton Coleman, a luxury real estate specialist with One Sotheby’s International Realty, holding the Certified Luxury Home Marketing Specialist (CLHMS) Million Dollar Guild designation, Certified Negotiation Expert (CNE), Transnational Referral Certification (TRC), and Resort & Second-Home Property Specialist (RSPS) designations.
View all available Miami-Dade luxury properties at MiamiPenthousesandEstates.com, or contact me directly for a personalized market analysis specific to your property or target submarket.
📞 Call or text: 305.978.7704
📧 Email: AColeman@onesothebysrealty.com
🌐 Search all Miami luxury real estate at MiamiPenthousesAndEstates.com

Data in this report is sourced from TrendGraphix Facts and Trends reports, based on information from the Southeast Florida Multiple Listing Service, the Realtor Association of Miami, and related regional MLS sources, published June 2026 and reflecting data through June 16, 2026. Geographic and price-tier scope for each figure is noted in the relevant section above. Neither the originating MLS boards nor TrendGraphix guarantees the accuracy of this data, and figures may not reflect all real estate activity in the market. This report is for informational purposes only and does not constitute financial, legal, or investment advice. Verify all data with your legal and financial advisors prior to entering any transaction.