


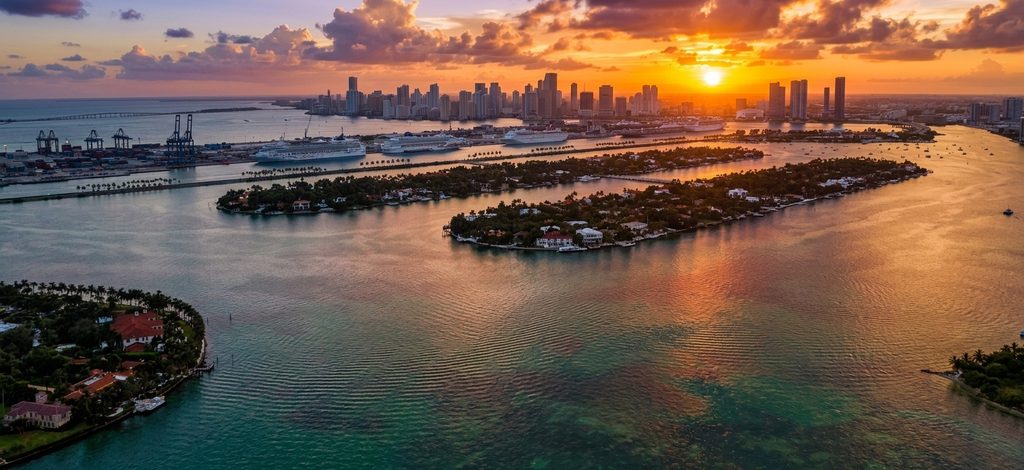
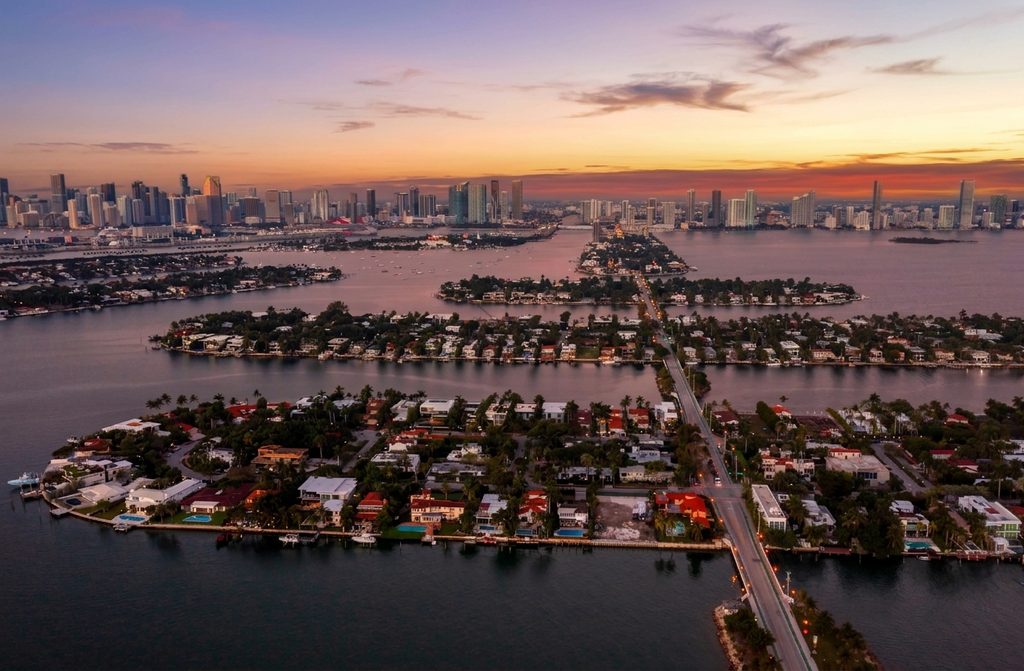
Miami Beach’s residential islands were largely created from Biscayne Bay during South Florida’s early development boom. Star, Palm and Hibiscus. The Venetian chain. The Sunset Islands. Much of this landscape did not exist in its present form a century ago.
They emerged from the same extraordinary idea: create scarce residential land in Biscayne Bay.
A century later, they do not trade anything alike. And the single largest price variable is not which island you are on. It is whether your lot reaches the water.
A review of 142 closed sales of $5 million and above across those islands, from January 2023 through September 2026, shows differences that are not small. And the single largest price variable is not which island you are on. It is whether your lot reaches the water.
The Seawall Premium
Comparing a waterfront house to an interior house on the same island removes almost every other variable. Same guard gate, same causeway, same schools, same address, often the same street. One backs onto Biscayne Bay. One does not.
| Island | Waterfront sales | Waterfront $/sq ft | Interior sales | Interior $/sq ft | Seawall Premium |
|---|---|---|---|---|---|
| Hibiscus Island | 14 | $3,625 | 6 | $1,458 | +149% |
| San Marino | 12 | $3,608 | 3 | $1,722 | +110% |
| Sunset Islands | 24 | $3,657 | 15 | $2,108 | +73% |
| Palm Island | 14 | $2,699 | 2 | $1,769 | +53% |
Across all islands combined:
| Waterfront | Interior | |
|---|---|---|
| Closed sales | 109 | 33 |
| Median sold price | $17,200,000 | $6,700,000 |
| Median price per living sq ft | $3,300 | $1,863 |
| Median days on market | 158 | 96 |
| Median sold to list | 91% | 92% |
The seawall is the clearest example of an attribute no budget can acquire after closing, which is why it commands what it does. It sits alongside land, view permanence and residence scarcity in the irreplaceability premium framework, the set of inputs that separate what a property is worth from what it cost to build.
An island waterfront home trades at a 77% premium per square foot over an interior home on the same islands. In total dollars the gap is wider still, because waterfront houses are also larger: $17.2 million against $6.7 million.
I call this the Seawall Premium: the measurable difference between waterfront and interior homes within the same Miami Beach island market. Across this dataset, it is one of the clearest pricing divides in island real estate.
Two things about it deserve attention.
It is not uniform. Hibiscus Island’s premium is nearly three times Palm Island’s. The seawall is worth far more on some islands than others.
Interior lots sell faster. Median 96 days against 158, and at a marginally better share of asking price. The interior market is smaller in dollars but more liquid. Fewer buyers can write a $17 million check than a $7 million one.
Why the Premium Varies So Much
The four islands with enough interior sales to measure tell four different stories.
Hibiscus Island (+149%) has the widest gap. Its interior lots are genuinely modest by island standards, and its waterfront commands $3,625 per square foot. The island offers the smallest step up in prestige from interior to waterfront, and the largest step up in price.
San Marino (+110%) produced the highest waterfront price per square foot of any Venetian island, alongside interior sales on the San Marino Terraces at roughly half that. Note the sample: three interior sales, and two of them are the same house.
Sunset Islands (+73%) has the most measurable interior market in Miami Beach, with 15 interior closings. That depth is why the 73% figure is the most trustworthy number in the table. The Sunset Islands interior is also the strongest interior market in absolute terms at $2,108 per square foot, well above every other island’s interior.
Palm Island (+53%) shows the narrowest gap, but on two interior sales. I would not lean on that figure. What it suggests, rather than proves, is that Palm Island’s interior holds value better relative to its waterfront than the other islands, which is consistent with Palm being a larger, more self-contained island where an interior address still carries the full Palm Island identity.
Comparing the Islands Two Ways
Ranking islands by median sold price and by price per square foot produces two different orders. That is the point.
| Island | Closed | Median sold | Median $/sq ft | Median CDOM | Sold/List | Waterfront share | Median year built |
|---|---|---|---|---|---|---|---|
| Star Island | 3 | $36,000,000 | $3,242 | 31 | 84% | 100% | 1992 |
| Di Lido | 17 | $18,500,000 | $3,464 | 134 | 93% | 94% | 1948 |
| San Marco | 9 | $17,350,000 | $2,866 | 143 | 94% | 89% | 2022 |
| Sunset Islands | 41 | $16,200,000 | $2,652 | 96 | 90% | 59% | 1981 |
| Palm Island | 17 | $14,995,000 | $2,682 | 374 | 86% | 88% | 1986 |
| San Marino | 16 | $12,719,882 | $3,556 | 132 | 88% | 81% | 1950 |
| Hibiscus Island | 20 | $12,050,000 | $2,584 | 183 | 91% | 70% | 2012 |
| Rivo Alto | 10 | $11,802,000 | $3,242 | 152 | 93% | 90% | 1944 |
| Biscayne Island | 9 | $10,750,000 | $2,677 | 399 | 91% | 78% | 2014 |
Star Island posted three sales in three and a half years. That is the entire dataset for the most famous address on this list, and it is not enough to rank against the others. It is included for completeness and should be read as three transactions, not as a market.
The highest median price and the highest price per square foot are not the same island. San Marino ranks sixth by median sold price at $12.7 million, but second by price per square foot at $3,556. Its median year built is 1950. The island trades small, old houses at very high unit prices, which is the signature of a market buying land and position rather than structures.
San Marco is the mirror image. Median year built 2022, the newest of any island, third by median price, seventh by price per square foot. Buyers there are getting more finished house per dollar.
Di Lido sits at the top of the Venetian chain on both measures, with 17 closings and 94% waterfront, and holds 93% of asking price.
The Liquidity Spread: Palm Island Takes a Year
The days-on-market column is where the islands separate most sharply.
| Island | Median days on market | Sold to list |
|---|---|---|
| Sunset Islands | 96 | 90% |
| San Marino | 132 | 88% |
| Di Lido | 134 | 93% |
| San Marco | 143 | 94% |
| Rivo Alto | 152 | 93% |
| Hibiscus Island | 183 | 91% |
| Palm Island | 374 | 86% |
| Biscayne Island | 399 | 91% |
The median Sunset Islands closing recorded 96 cumulative days on market. Palm Island’s median was 374 days, with sales closing at 86% of asking—the deepest discount among the islands measured.
That is not a statement about desirability. Palm Island produced a $45 million sale and a $40 million sale in this window. It is a statement about buyer pool depth. The higher the price and the narrower the buyer pool, the longer the marketing period and the more the final number owes to negotiation rather than to competition.
Biscayne Island’s 399 days come from the opposite direction. It is the least expensive island on the list at a $10.75 million median, sitting at the Miami end of the Venetian causeway, and it takes longer to find its buyer than islands costing twice as much.
The pattern parallels what the same analysis shows in ultra-luxury condominiums, where transaction depth and asking-price density matter more to an eventual exit than headline prestige does.
The Same House, Sold Twice
Median prices move for reasons that have nothing to do with the market. A quarter with three waterfront closings and a quarter with three interior closings will produce very different medians in an unchanged market.
Repeat sales remove that problem entirely. The same house. The same square footage. Two dates.
Six properties in this dataset sold twice with unchanged living area:
| Property | First sale | Second sale | Held | Change | Annualized |
|---|---|---|---|---|---|
| 2815 Regatta Ave, Sunset Islands | Oct 2023, $5,200,000 | Apr 2026, $6,700,000 | 30 months | +28.8% | +10.8% |
| 508 W Di Lido Dr | Mar 2026, $18,500,000 | Aug 2026, $22,750,000 | 5 months | +23.0% | +63.3% |
| 65 S Hibiscus Dr | Sep 2023, $9,000,000 | May 2025, $9,933,333 | 20 months | +10.4% | +6.1% |
| 16 Palm Ave | Nov 2025, $22,850,000 | Jun 2026, $25,000,000 | 6 months | +9.4% | +18.2% |
| 114 3rd San Marino Ter | May 2023, $5,200,000 | Mar 2026, $5,200,000 | 34 months | 0.0% | 0.0% |
| 247 E Rivo Alto Dr | Jan 2023, $16,700,000 | Jun 2024, $14,500,000 | 17 months | -13.2% | -9.6% |
Four of six resold higher. The median pair gained 9.9% over an 18-month hold.
Three of these deserve comment.
114 3rd San Marino Ter sold for exactly $5,200,000 twice, 34 months apart. An interior San Marino house, 3,019 square feet, unchanged in price across nearly three years while the island market around it was rising. That is the interior market in one data point.
247 E Rivo Alto Dr lost 13.2% between January 2023 and June 2024, a waterfront house that resold below its purchase price inside 17 months. It is the only clear loss among the six.
508 W Di Lido Dr resold 23% higher after five months. A pair that short is almost certainly a renovation or furnishing play rather than market movement, and I would not read it as appreciation. It is included because excluding inconvenient records is how analyses become marketing.
Six pairs is a small sample and I would not build a price index on it. But it is direct evidence, and direct evidence of what an island house actually did between two dates is rare enough to be worth more than another median.
The Trend: Up 31% Per Square Foot Since 2023
| Year closed | Closings | Median sold price | Median $/sq ft |
|---|---|---|---|
| 2023 | 28 | $12,250,000 | $2,577 |
| 2024 | 37 | $14,000,000 | $2,724 |
| 2025 | 35 | $15,000,000 | $3,132 |
| 2026 (through September) | 42 | $15,850,000 | $3,387 |
The median sold price per living square foot in this dataset increased from $2,577 in 2023 to $3,387 in 2026, while median sold price increased from $12.25 million to $15.85 million. Those figures describe the transactions that occurred; they should not be interpreted as a controlled same-property appreciation index because the mix of islands, waterfront exposure and individual properties changes each year.
Transaction activity is nevertheless notable. Through September, 2026 had already produced 42 qualifying closings, exceeding the full-year totals recorded in 2023, 2024 and 2025. Rising transaction volume alongside higher observed medians is stronger evidence of market participation than price movement occurring on progressively fewer sales—but property mix remains an important limitation.
What Is Actually For Sale Right Now
| Island | Active listings | Median asking | Closings since Jan 2023 |
|---|---|---|---|
| Hibiscus Island | 12 | $18,999,500 | 20 |
| Palm Island | 8 | $26,400,000 | 17 |
| Di Lido | 7 | $29,000,000 | 17 |
| Rivo Alto | 7 | $17,500,000 | 10 |
| San Marco | 5 | $16,900,000 | 9 |
| Sunset Islands | 4 | $14,875,000 | 41 |
| San Marino | 2 | $32,997,500 | 16 |
| Biscayne Island | 1 | $6,575,000 | 9 |
| Star Island | 0 | n/a | 3 |
Read the last two columns together.
Rivo Alto currently has 7 active listings compared with 10 qualifying closings during the entire three-and-a-half-year study period. That is unusually heavy internal competition relative to its recent transaction depth.
Sunset Islands has four active listings against 41 qualifying closings over the same period—an entirely different competitive environment for sellers.
San Marino has 2 listings, and a median ask of $32,997,500 against a $12.7 million median closing. Both listings are at the extreme top of the island’s range. There is effectively nothing available on San Marino in its normal price band.
Star Island currently has nothing listed above $5 million and produced three sales in three and a half years. It is the clearest illustration on this page of the difference between prestige and liquidity.
What This Means for Buyers
For pricing, the seawall can matter more than the island. Moving from an interior lot to a waterfront lot on the same island costs 53% to 149% more per square foot. Moving between islands costs far less than that. If budget is the constraint, an interior lot on a better island is usually available for less than waterfront on a lesser one.
Interior lots are the liquid end of the island market. 96 days against 158, at a slightly better share of asking. If you expect to sell inside five years, that matters.
On many San Marino and Rivo Alto transactions, buyers should think about the land and position separately from the existing structure. Median year built 1950 and 1944, at $3,556 and $3,242 per square foot. Price those purchases as parcels, not as improved property, the same way the top of the Miami-Dade market prices trophy land.
On Palm Island, budget a year. The median closing took 374 days and landed at 86% of asking. That is a negotiating position for a buyer and a planning problem for a seller. Compare the interior lot against a condominium, not only against waterfront. A buyer who gives up the seawall is often deciding between an island interior lot and a high-floor residence with a permanent water view. In closings above $10 million, non-waterfront houses ran $1,657 per square foot with a median of 7,983 interior square feet, while condominiums ran $3,138 per square foot with a median of 4,740. That is the real trade: space and land against height and services. I measured it in the Miami house versus condo comparison at $10 million and above.
What This Means for Sellers
If you own an interior lot, do not price off waterfront comparables on your own island. The gap is 53% to 149% per square foot. On Hibiscus Island a waterfront comparable is close to useless as a guide to an interior value.
Check how much of your island is currently listed. Seven active listings on Rivo Alto against ten sales in three and a half years is a materially different selling environment than four listings on the Sunset Islands against forty-one sales.
If your house is old and your position is good, sell the position. San Marino’s waterfront transactions produced a median $3,608 per living square foot despite a much older housing stock. In some cases, buyers may be placing substantial value on the waterfront position and redevelopment potential rather than simply the existing structure.
Expect 91% of asking if you are on the water, 92% if you are not. Across 142 closings those numbers barely move. Pricing above the evidence does not produce a higher sale. It produces a longer one.
Frequently Asked Questions
How much more is a waterfront home worth on Miami Beach’s islands?
Across 142 closed sales from January 2023 through September 2026, island waterfront homes closed at a median of $3,300 per living square foot against $1,863 for interior homes on the same islands, a 77% premium. Measured island by island, the premium ranged from 53% on Palm Island to 149% on Hibiscus Island.
Which Miami Beach island is the most expensive?
It depends on the measure. Star Island produced the highest median sold price at $36,000,000, but on only three transactions in three and a half years. Among islands with meaningful volume, Di Lido led on median sold price at $18,500,000, while San Marino led on price per square foot at $3,556.
Is Star Island worth it?
Star Island produced three closed sales above $5 million between January 2023 and September 2026, and currently has no active listings in that range. That is too little activity to analyze as a market. Its value proposition is scarcity and exclusivity rather than demonstrated transaction depth.
How long does it take to sell a home on Palm Island?
The median Palm Island closing in this dataset took 374 cumulative days on market and closed at 86% of the original asking price, the slowest and deepest-discounting island measured. The Sunset Islands, by contrast, had a median of 96 days at 90% of asking.
Are Miami Beach island homes appreciating?
The transaction evidence points upward, but it should not be confused with a same-home price index. Median sold price per living square foot increased from $2,577 in 2023 to $3,387 in 2026, a 31% increase in the properties that traded. Six unchanged-square-footage repeat-sale pairs showed a median gain of 9.9% over a median 18-month hold, with four of six reselling higher. Property mix and the small repeat-sale sample prevent treating either measure as a precise appreciation rate.
What is an interior lot on a Miami Beach island worth?
Interior island homes closed at a median of $6,700,000 and $1,863 per living square foot. The strongest interior market measured was the Sunset Islands at $2,108 per square foot across 15 closings. The weakest was Hibiscus Island at $1,458 across six.
Do interior island homes sell faster than waterfront?
Yes. Interior homes closed in a median of 96 days against 158 for waterfront, at a marginally higher share of asking price. The interior buyer pool is deeper because the price points are lower.
Buying or Selling a Miami Beach Island Home?
Waterfront value on Miami Beach’s islands cannot be reduced to the island name or an average price per square foot. Exposure, waterway, lot position, existing improvements, redevelopment potential and the depth of competing inventory can materially change the value of two homes only a few blocks apart.
If you’re evaluating a property on Star Island, Palm or Hibiscus Island, the Venetian Islands or the Sunset Islands, contact Ashton Coleman for a property-specific comparison using recent closed sales and current competing inventory.
Explore current Miami Beach island homes and waterfront properties through Miami Penthouses & Estates.
Methodology and Data Disclosure
This analysis uses supplied SEFMLS records for single-family residences priced at $5,000,000 and above on Miami Beach’s man-made islands, covering 142 closed sales with recorded sale prices closing between January 2023 and September 2026, together with 47 current active and pending listings.
Islands are grouped from MLS subdivision names. Palm Island includes the Riviera 1st and 2nd Addition subdivision, which covers Palm Avenue and North and South Coconut Lane. Sunset Islands includes Sunset Islands 1 through 4 and the Sunset Lake Extension. The Venetian chain is reported as its separate islands: Biscayne Island, San Marco, San Marino, Di Lido and Rivo Alto.
Price per square foot throughout this article refers to living area, not lot area. This export did not include lot size or water frontage, so land-based measures are not calculated here, and the figures are not directly comparable to land-value analyses published elsewhere on this site.
Several groupings carry small samples and are directional rather than precise. Star Island contains three closings. Palm Island’s interior figure rests on two sales, San Marino’s on three, and two of those three are the same house sold twice. Interior comparisons are reported only where at least two waterfront and two interior sales exist, and the Sunset Islands figure, built on 24 waterfront and 15 interior closings, is the most reliable in the table.
Repeat-sale pairs include only properties where reported living area was unchanged between transactions, to exclude sales separated by expansion or reconstruction. Three additional repeat pairs were identified and excluded on that basis. Pairs closing less than roughly three months apart are noted where included. Renovation, furnishing, concessions, off-market activity and seller circumstance all affect individual transactions and are not captured by summarized MLS fields.
Waterfront status uses the MLS waterfront flag and does not distinguish between open bay, protected water, canal or basin exposure. Annual medians reflect the mix of properties that closed in each year and are not a controlled repeat-sales price index.
This analysis does not rank islands and should not be read as doing so. MLS information is believed accurate but is not guaranteed.

Disclaimer
This article is provided for general real estate information and marketing purposes and is not an appraisal or financial, tax, legal, or investment advice. Individual properties, marketability and resale outcomes vary substantially. Buyers and sellers should evaluate property-specific information and current market conditions before making a real estate decision.