


Sunny Isles Beach’s luxury condo market has generated two competing narratives in 2026 — one built on June’s headline numbers, one built on the year-to-date picture — and both are accurate, which is exactly why they need to be read together rather than separately. This report does that.
This is the MLS-sourced Sunny Isles Beach condo market update for Q3 2026, covering all $1 million and above condominiums in Sunny Isles Beach specifically. The data comes from two TrendGraphix Facts and Trends reports published July 2026: a 3-year calendar quarter snapshot and a 15-month rolling window that together give the most complete picture of where this market has been and where it is right now.
The honest summary before the detail: Sunny Isles Beach’s $1M+ condo market is improving directionally — inventory is contracting, absorption pace is improving, and June 2026 produced the market’s strongest single-month performance in over a year. But the year-to-date sold price and price-per-square-foot figures are running below last year’s pace, months of inventory remain well into buyer’s-market territory at 13.9, and the monthly volatility in this market is significant enough that any single month’s numbers need to be read against the longer trend rather than taken as confirmation of a new baseline. This is a market in transition, not one that has completed its recovery.
Inventory: The Clearest Positive Signal
The most unambiguously positive trend in this data is the inventory contraction — and it has been sustained long enough to be meaningful rather than a short-term fluctuation.
Active listings in June 2026 stood at 431 units — down 2.9% from May and down 14% from June 2025. The 15-month chart tells the fuller story: inventory peaked at 517 active listings in May 2025 and has been declining steadily since, reaching 431 in June 2026 — a 16.6% decline from peak over 13 months. The early July 2026 figure of 425 continues that trend downward.
For buyers and sellers evaluating Sunny Isles Beach, this inventory contraction is the single most important structural development in the market over the past year. A market with 431 active listings is meaningfully less competitive for sellers than the same market with 517 active listings — and the trend line is clearly pointed in the seller-favorable direction even if the current absolute level of inventory still favors buyers by the conventional standard.
The context that matters: even at 431 listings, Sunny Isles Beach remains a buyer’s market by months-of-inventory calculation. At 13.9 months of inventory in June — down dramatically from May’s anomalous 49.3 spike, which reflected a single month of very low closings rather than a genuine inventory surge, and down 33.5% from June 2025’s 20.9 months — the market has improved considerably on this metric over the past year. But 13.9 months is still more than twice the 6-month threshold that defines a balanced market, and sellers should not mistake the directional improvement for a market that has flipped to their favor.
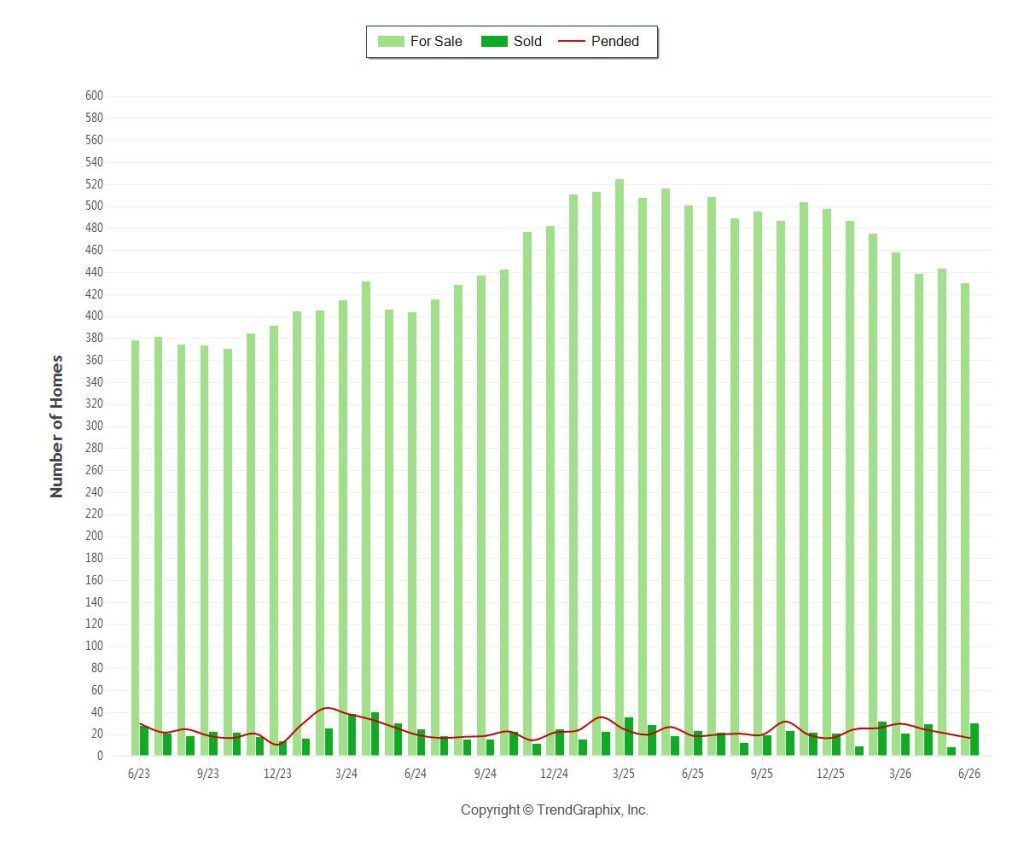
Data sourced from TrendGraphix Facts and Trends, Southeast Florida MLS, Sunny Isles Beach condominiums $1M+, published July 2026.
Sales Volume: June’s Surge in Context
June 2026 produced 31 closings in Sunny Isles Beach’s $1M+ condo market — up 244% from May’s 9 closings and up 29.2% from June 2025’s 24. Those are striking numbers that need immediate context to be read honestly.
May’s 9 closings was an unusually low month — the 15-month chart shows the market averaging 17 to 32 closings per month over this period, making 9 an outlier on the low end. June’s 31 closings look explosive against that comparison but is closer to a return to normal than a genuine surge. Against the 15-month average, June 2026 is a solid but not extraordinary month.
The trailing-quarter view confirms this reading. April through June 2026 produced 70 total closings, versus 72 closings in the same quarter of 2025 — essentially flat year-over-year. The YTD figure of 151 closings compares to 162 closings through the same period last year — down 6.8% year-over-year. Total sales volume is slightly below last year’s pace on a YTD basis, even with June’s strong month factored in.
The pending sales figure tells the forward-looking story: 9 pending sales in the current MTD (July 1–27, 2026), down 50% from the same period last year’s 18. 155 YTD pendings versus 169 the prior year — down 8.3%. The pipeline for the second half of 2026 is running below last year, suggesting the second half is unlikely to dramatically outperform the first without a meaningful change in buyer activity.
What this means for sellers: Pricing your unit as though June’s 244% month-over-month surge represents a sustained market recovery would be a mistake. The YTD context shows a market that is performing slightly below last year’s pace on volume. The opportunity is in June’s improvement — not in extrapolating it as the new baseline.
What this means for buyers: June’s absorption suggests that well-priced, well-presented inventory is transacting. Buyers who have been waiting for distress pricing are waiting for a condition that the improving inventory picture makes less likely over time. The leverage available today is real and documented — but it is narrowing directionally, not widening.
Pricing: The Honest Two-Part Story
This is where the two competing narratives live, and why both need to be presented together.
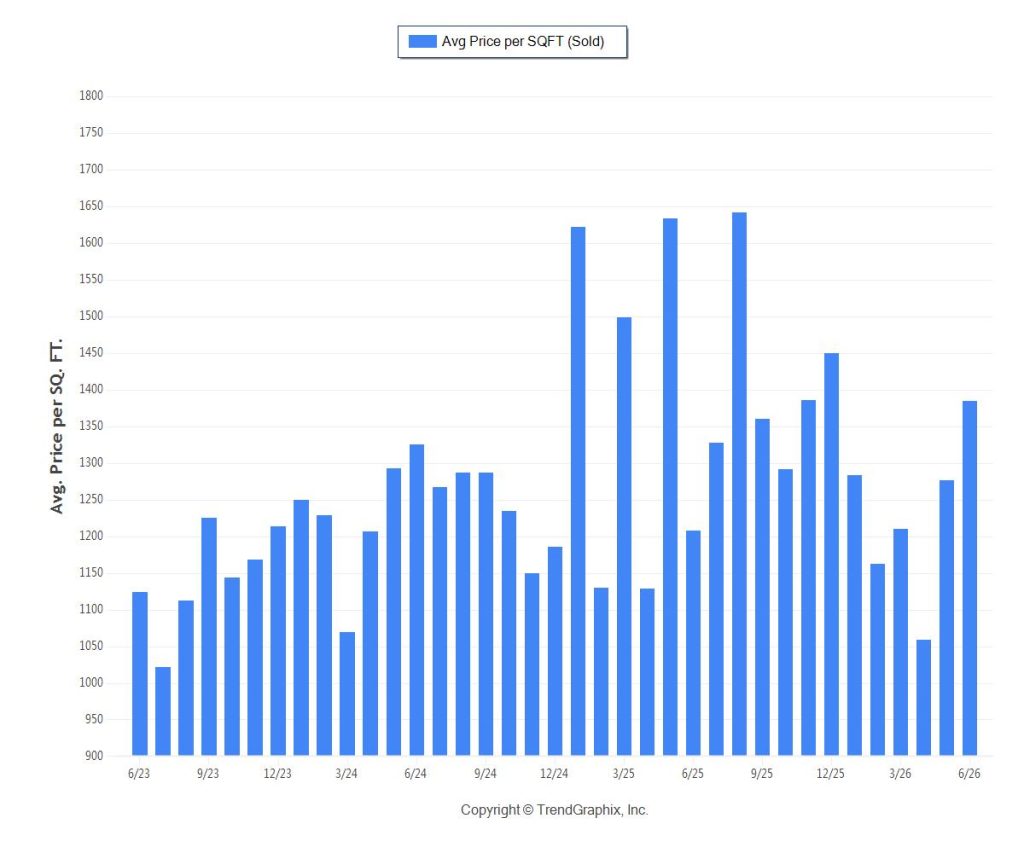
The June 2026 story: Average sold price in June was $3,916,000 — up 34.3% from May and up 26.5% from June 2025’s $3,096,000. Average sold price per square foot in June was $1,384 — up 8.5% from May and up 14.6% from June 2025’s $1,208. If you read only June’s figures, Sunny Isles Beach’s $1M+ condo market is appreciating strongly.
The YTD 2026 story: Average sold price year-to-date is $2,984,000 — down 14.9% from the same period last year’s $3,508,000. Average sold price per square foot YTD is $1,193 — down 11.4% from last year’s $1,346. If you read only the YTD figures, Sunny Isles Beach’s pricing is softening relative to 2025’s pace.
Both readings are accurate. The reconciliation is in the 15-month price chart, which shows the significant month-to-month volatility inherent in a market where 17 to 31 closings per month can include several large transactions that dramatically swing the average. The average sold price has ranged from $2,692,000 in March 2026 to $4,903,000 in August 2025 — a $2.2 million swing within fifteen months — reflecting how powerfully individual large transactions shape the monthly average in this market.
The trailing-twelve-month average is the more stable figure: $3,389,000 average sold price and $1,299/sqft, both close to flat versus the prior two-year period. That stability, in a market with elevated inventory and a buyer’s-market classification, is actually a meaningful signal: Sunny Isles Beach’s $1M+ pricing has not collapsed despite the inventory overhang, because the supply of genuinely trophy product — Estates at Acqualina, Porsche, Jade Signature, St. Regis, Bentley Residences — continues to command premiums that hold the average up.
Average active listing price provides the other half of the pricing picture: $3,993,000 in June 2026, up 5.8% YoY — sellers are still asking more than they were a year ago. But average sold price of $3,916,000 versus average active price of $3,993,000 implies a very thin gap between ask and close — a signal that the listings that are actually selling are the ones priced accurately, not the full inventory of 431 listings at the current average asking level.
Days on Market: Genuinely Improving
The days-on-market trend is the most straightforward positive signal in the entire dataset, and it is real.
June 2026 average days on market: 131 — up 31% from May’s 100 but down 26.8% from June 2025’s 179. The year-to-date average of 143 days compares favorably to the prior year’s 154 days — a 7.1% improvement. The 15-month chart shows a consistent downward trend from the 170-day peak in January 2026 to the 100-day reading in May 2026, with June’s 131 likely reflecting the typical seasonal pattern rather than a reversal of that trend.
The sold-to-original-list-price ratio of 91% in June 2026 — up 2.2% YoY — is the companion metric that confirms the absorption improvement. Sellers in Sunny Isles Beach are getting closer to their original asking price than they were a year ago, even in a buyer’s market. The buyers who are transacting are doing so with less negotiating concession from the seller than the market’s inventory levels alone would suggest — which points to the pricing discipline of the sellers who are actually closing: they are pricing accurately rather than aspirationally, and the market is rewarding that.
The Buildings Driving the Market
The Sunny Isles Beach $1M+ condo market is not a monolithic market — it is a collection of building-specific micro-markets, each performing differently, and the blended averages above reflect all of them combined. Understanding which buildings are driving the market’s strongest performance requires building-specific data beyond what this report can provide, but the context from the broader guide series is relevant.
The Estates at Acqualina remains the delivered building with the highest average sold price per square foot in Sunny Isles Beach — $2,787/sqft average as of earlier 2026 data — and its $21.6M tower suite closing on June 30, 2026 (confirmed in the MLS-verified penthouse transaction table published in this guide series) confirms it is still transacting at premium levels. This building is almost certainly contributing disproportionately to June’s strong average sold price and per-square-foot figures.
The pre-construction tier — Bentley Residences (targeting Q1 2028, from $5.8M) and St. Regis Residences Sunny Isles Beach (South Tower Q4 2028, North Tower Q4 2029, from $5M) — represents future supply that is selling but not yet closing. These buildings’ pre-construction contracts will eventually show up in the MLS closing data at delivery and are likely to push Sunny Isles Beach’s average sold price per square foot higher when they land. For buyers considering a resale versus pre-construction decision, the timeline differential is meaningful: resale product offers immediate occupancy in a buyer-favorable negotiating environment today; pre-construction offers newer specifications at a premium and a 2028–2029 wait.
What I Am Telling Buyers and Sellers Right Now
For buyers in Sunny Isles Beach’s $1M+ condo market:
The directional trends — inventory contracting, absorption improving, sold-to-list ratio rising — are moving against the buyer’s leverage position over time. That doesn’t mean the leverage is gone; 13.9 months of inventory and a YTD sold price running 14.9% below last year’s pace confirm that buyers still have real room to negotiate on resale product. But the window where that leverage is at its widest is more likely behind us than ahead.
Specifically: buyers who have been monitoring specific units in specific buildings and waiting for a further price reduction should be making decisions rather than waiting. The 131 average days on market means well-priced inventory takes roughly four months to find a buyer — units that have been sitting longer are either overpriced or have a building-specific issue worth investigating.
For pre-construction buyers evaluating Bentley or St. Regis: the conversation is different. Pre-construction pricing reflects the developer’s view of where the market will be at delivery, not where the resale market is today. The $1M+ resale data above is relevant context but not a direct comparable for a 2028-2029 delivery.
For sellers in Sunny Isles Beach’s $1M+ condo market:
June’s strong closing numbers are encouraging but should not be the basis for aggressive pricing. The YTD sold price running 14.9% below last year confirms that the market’s average transaction is occurring at lower absolute prices than 2025’s pace, even as individual months show improvement. The 91% sold-to-original-list ratio is the most actionable metric for sellers: units that are selling are closing at 91 cents on the original dollar — which means the seller who prices at $X and expects to negotiate to $0.91X is in line with the market. The seller who prices at $X expecting to negotiate to something much closer to $X is going to accumulate days on market.
Frequently Asked Questions
Is Sunny Isles Beach a buyer’s or seller’s market in 2026?
By the conventional months-of-inventory measure, Sunny Isles Beach’s $1M+ condo market is a buyer’s market — 13.9 months of inventory as of June 2026, well above the 6-month balanced-market threshold. The directional trend is improving — down from 20.9 months a year ago and from a 49.3-month spike in May 2026 — but the market has not yet reached neutral conditions.
What is the average price per square foot for Sunny Isles Beach condos at $1M+?
June 2026 average sold price per square foot was $1,384 — up 14.6% from June 2025. The YTD 2026 average is $1,193/sqft, down 11.4% from the prior year’s $1,346. The trailing twelve-month average of approximately $1,299/sqft is the more stable figure, reflecting the significant month-to-month volatility in this market.
How many condos are for sale in Sunny Isles Beach at $1M+?
As of late June 2026, there were 431 active $1M+ condo listings in Sunny Isles Beach — down 14% from June 2025’s 501. Active inventory has been declining steadily since the May 2025 peak of 517.
How long does it take to sell a luxury condo in Sunny Isles Beach?
Year-to-date 2026, average days on market for $1M+ condos in Sunny Isles Beach is 143 days — down from 154 days the prior year. June 2026’s 131-day average was down 26.8% from June 2025’s 179 days, confirming that absorption pace has improved meaningfully over the past twelve months.
What is the sold-to-list price ratio in Sunny Isles Beach?
June 2026’s sold-to-original-list-price ratio was 91% — up 2.2% from June 2025. The YTD average is also 90%, up 3.4% from the prior year’s 87%. Sellers who price accurately are closing at approximately 90–91 cents on their original asking dollar.
Which Sunny Isles Beach condos are performing best in 2026?
The Estates at Acqualina leads the delivered luxury market at $2,787/sqft average, confirmed by a $21.6M tower suite closing on June 30, 2026. Jade Signature by Herzog & de Meuron (Pritzker Prize architects) maintains a consistent premium over the broader market average. In the pre-construction tier, Bentley Residences and St. Regis Residences Sunny Isles Beach are the two most actively selling projects. Building-specific pricing data is available on request.
Ready to Act in Sunny Isles Beach?
Sunny Isles Beach’s $1M+ condo market in Q3 2026 is a market where direction matters more than any single month’s headline. The direction is improving — inventory contracting, absorption pace strengthening, the sold-to-list ratio rising — and the buyers and sellers who understand that directional shift will make better decisions than those reading only the month-over-month headlines in either direction.
View all available Sunny Isles Beach luxury condos at MiamiPenthousesandEstates.com, or contact me directly for a building-specific market analysis and current availability. For a building-specific Sunny Isles Beach market analysis, current comparable sales or available residences, contact me directly.
📞 Call or text: 305.978.7704
📧 Email: AColeman@onesothebysrealty.com
🌐 Search Sunny Isles Beach luxury condos: MiamiPenthousesandEstates.com
Market data in this report is sourced from TrendGraphix Facts and Trends reports based on Southeast Florida MLS records, scoped to condominium properties in Sunny Isles Beach at the $1,000,000 and above price tier, published July 2026 and reflecting data through July 27, 2026. All figures are subject to change. This report is for informational purposes only and does not constitute financial, legal, or investment advice. Verify all data with your legal and financial advisors prior to entering any transaction.