


Covering Aventura, Bal Harbour, Bay Harbor Islands, Coconut Grove, Coral Gables, Eastern Shores, Fisher Island, Golden Beach, Key Biscayne, Miami Beach, Miami Shores, North Bay Village, North Miami Beach, Sunny Isles Beach, Surfside, and Williams Island.
If you’ve been house-hunting — or listing — anywhere along Miami’s coastal corridor over the past two years, you already know the story without needing a single chart: too many homes for sale, sitting too long, with sellers grudgingly coming down in price to get anything done. That’s been the defining condition of this market since the post-pandemic pricing surge cooled off in 2023.
The June 2026 MLS data changes the conversation — carefully. Pulled from MLS TrendGraphix Facts and Trends reports at both the $1,000,000-and-up and $5,000,000-and-up price tiers, and cross-referenced against three full years of monthly and quarterly history, the numbers show the clearest sustained tightening this market has produced since the correction began. But a careful read of the same data also shows exactly where that story gets ahead of itself. Here’s the honest version, tier by tier.
The Three-Year Backdrop: How We Got Here
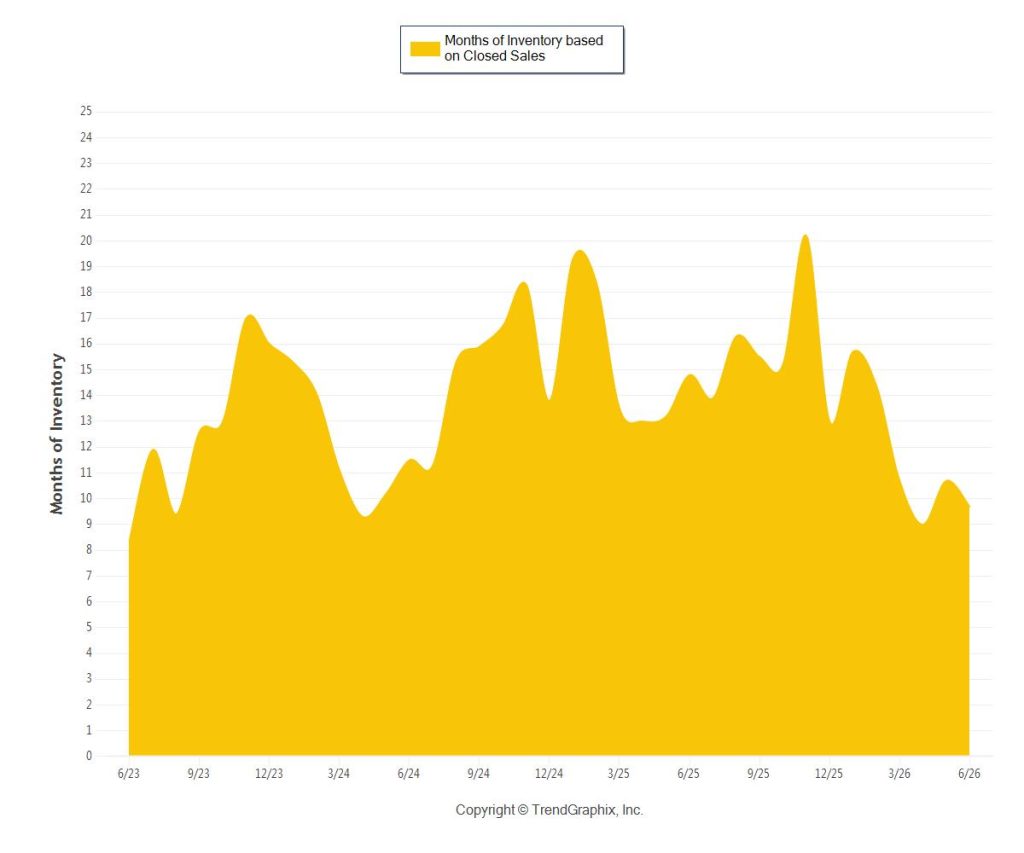
Rewind to June 2023 and the $1M+ coastal segment was carrying 8.4 months of inventory — a seller’s-leaning market fresh off the 2021–2022 boom. From there, inventory climbed steadily through 2023 and 2024, peaking at 20.2 months in November 2025 — deep buyer’s-market territory, more than triple the seller’s-market threshold of 3 months. That two-and-a-half-year climb is the backdrop against which June 2026’s improvement has to be measured: this isn’t a market returning to “normal” from a brief dip; it’s a market that spent over two years getting progressively heavier before this year’s turn.
The $5M+ ultra-luxury tier tells a similar but more volatile version of the same story, spiking to 63.2 months of inventory in December 2023 — an extreme reading driven by a handful of stalled high-end closings in a thin sample — before settling into a choppier 15-to-30-month range through most of 2024 and 2025.
The Broad Market ($1M+): A Real, Multi-Month Tightening
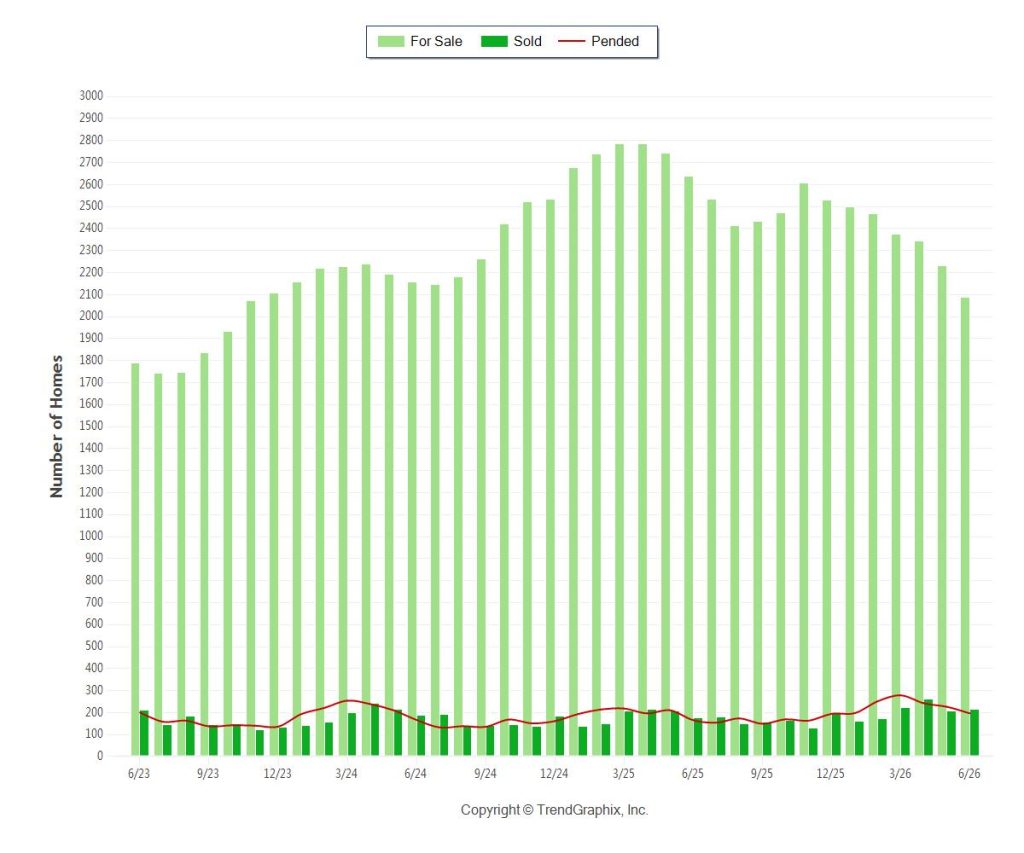
At the $1M+ level, the sample size is large enough to trust — 2,088 active listings and 216 closings in June alone, spread across all 14 coastal municipalities in this report. The direction across nearly every metric is consistent:
- Months of inventory based on closed sales fell to 9.7, down 34.4% from 14.8 a year ago, and down from a 20.2-month peak just seven months earlier in November 2025.
- Absorption rate on closed sales climbed to 10.3% of active inventory, up from 6.8% in June 2025 — roughly 50% faster turnover.
- Sold/Original List Price ratio rose to 91%, up from 88% a year ago, meaning sellers are conceding less off their original asking price to get a deal done.
- Days on market held essentially flat at 118 (up modestly from 113 a year ago) — properties aren’t moving dramatically faster yet, but they’re not sitting longer either, which matters given how much inventory has come down.
- New listings in June (353) came in noticeably below the 2025 monthly average, which is itself part of why inventory is falling — fewer new sellers testing the market alongside stronger absorption of what’s already listed.
- Median sold price rose from $2.15M to $2.805M year-over-year, about 30% — a steadier and more trustworthy figure than the average (see below).
Taken together, this is a genuine, broad-based absorption story. It isn’t being manufactured by one lucky month or one large transaction — the sample is deep enough that this reflects real buyer behavior across a wide cross-section of $1M-plus coastal inventory.
The Ultra-Luxury Tier ($5M+): Same Direction, Thinner Ice
At $5M+, the headline numbers rhyme with the broader market, but the confidence interval around them is much wider. Only 57 homes closed in June across all 14 markets combined — a number small enough that a handful of extra transactions can swing month-over-month percentages by double digits.
- Months of inventory fell to 9.6, down 60.2% from 24.1 a year ago — the sharpest improvement in this data set, and one worth taking seriously, but also one built on a jump from 26 closings a year ago to 57 this year. That’s an increase of 31 transactions spread across an enormous geographic footprint from Golden Beach to Coconut Grove.
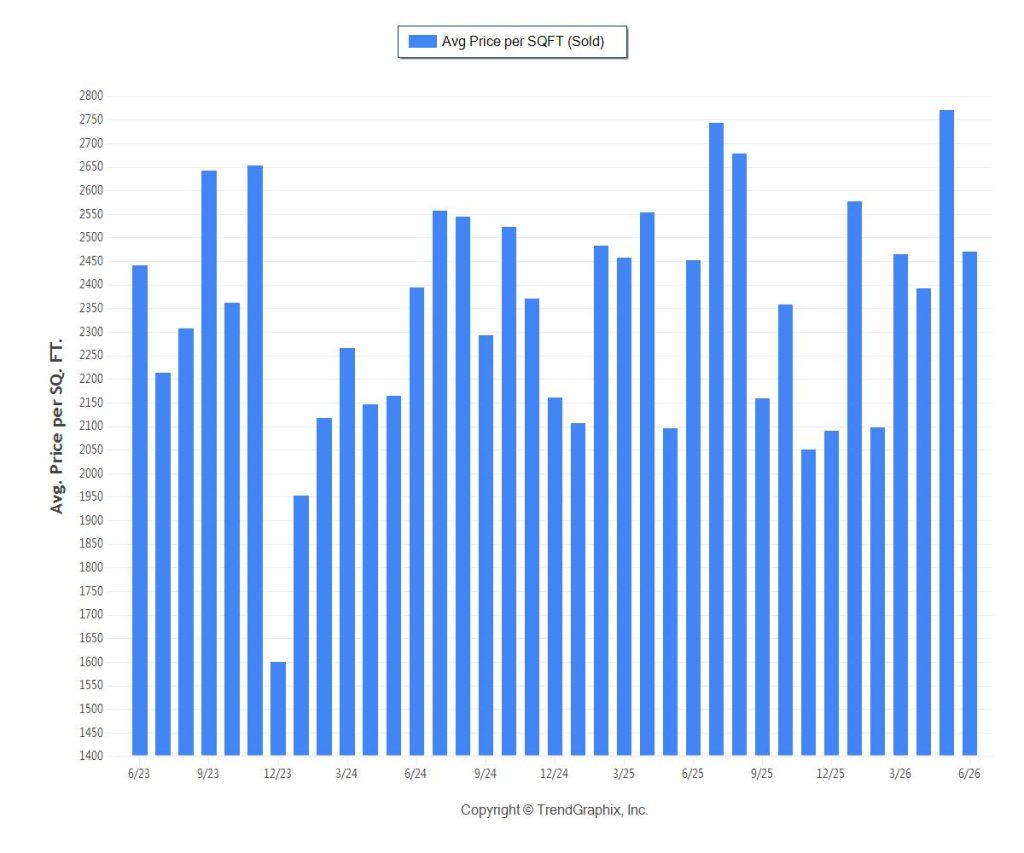
- Average sold price climbed to $12.0 million, up 8.2% year-over-year — but average sold price per square foot actually fell 10.8% month-over-month to $2,471. Those two figures moving in opposite directions is a tell: at this price point, which specific properties happen to close in a given month drives the averages more than any underlying pricing trend. A $30M penthouse and a $5.2M condo closing in the same 30-day window can move the per-square-foot average by hundreds of dollars without the market itself shifting at all.
- Days on market actually fell to 125, down 5.3% year-over-year, and the Sold/Original List Price ratio held at 91% — both consistent with genuine improvement, not just an averages artifact.
The direction is real. The magnitude deserves a raised eyebrow until a few more months confirm it.
The Honest Caveat: Don’t Get Ahead of One Month
Here’s the flag that belongs in every version of this report, regardless of how good June looked: July’s partial-month data (through July 29) shows months-of-inventory reversing in both tiers — up 29% at $1M+ and up a full 107% at $5M+ compared to the same point in June. Some of that is simply arithmetic — a 29-day partial month naturally shows fewer closings than a completed 30-31 day month, which mechanically inflates the inventory-months calculation. But it’s also a real reminder that June was one strong month sitting at the end of a multi-year downtrend in inventory, not yet a confirmed, stable new normal. The responsible framing, and the one this market has earned: the buyer’s market is narrowing — it has not flipped.
What This Means If You’re Buying or Selling
If you’re selling at $1M+: Pricing at or near current market value has real payoff right now. A 91% sold-to-original-list ratio means buyers are punishing overpriced listings less than they were a year ago — but they haven’t stopped punishing them. Sellers who list 15-20% over comparable recent sales in this environment are still the ones adding months to their own days-on-market clock.
If you’re buying at $1M+: The deepest-discount window of the past two years is likely behind us. Absorption is accelerating and days on market held flat despite a much smaller pool of active listings, which is exactly the combination that precedes list prices firming up further. If you’ve been waiting for a bottom, the data suggests you’re closer to it having already passed than to it still arriving.
If you’re buying or selling at $5M+: More patience — and more reliance on actual comparable closed sales rather than headline monthly averages — is still warranted. This tier’s small transaction count means any single month’s average price or price-per-square-foot figure can be noisy in either direction. Ask your agent for the specific comparables behind any number you’re quoted, not just the MLS Facts and Trends monthly summary.
Frequently Asked Questions
Is Miami’s luxury coastal market a buyer’s or seller’s market right now?
Both tiers remain technically buyer’s markets under the standard 3/6-month thresholds (more than 6 months of inventory based on closed sales). The $1M+ segment, at 9.7 months, is the tightest it’s been in over two years and is trending toward the 3-6 month neutral range — but it isn’t there yet.
Why did the average sold price jump 42% at $1M+ if the market isn’t overheating?
That figure — from $3.402M to $4.842M year-over-year — is skewed by a shift toward more closings at the higher end of an uncapped price range (this data has no ceiling above $1M). The median sold price, up a steadier ~30% to $2.805M, is the more reliable gauge of what a typical buyer in this segment is actually paying.
Should I trust one strong month of improving data?
Not in isolation. June 2026 produced the strongest inventory and absorption numbers in this three-year data set, but July’s early partial-month figures show inventory ticking back up in both tiers. Two to three more months of confirmation would turn this from a notable month into a confirmed trend.
Why do the $1M+ and $5M+ figures sometimes move in different directions?
Sample size. The $1M+ tier includes over 2,000 active listings and 200+ monthly closings — enough volume that month-to-month percentage changes reflect real market behavior. The $5M+ tier, with under 60 closings a month across 14 municipalities, is far more sensitive to which specific properties happen to close in any given 30-day window.
Which coastal areas are driving the $5M+ absorption?
This report combines all 14 municipalities from Golden Beach to Coconut Grove into one figure, so it can’t isolate a single submarket’s contribution from the aggregate data alone. If you’re evaluating a specific building or neighborhood at this price point, ask for building-level or ZIP-level MLS data rather than relying on the coastal-wide average.
Market data sourced from MLS TrendGraphix Facts and Trends reports, published July 2026, based on closed MLS data through June 2026, with three-year historical context from June 2023 forward. Data is provided by the Realtor Association of Miami, the Greater Fort Lauderdale Realtors, and the Southeast Florida MLS; neither the Board nor its MLS guarantees its accuracy, and figures may not reflect all real estate activity in the market. ONE Sotheby’s International Realty is the sales team for select new-development coastal properties referenced across this site.
Ashton Coleman, Broker-Associate, ONE Sotheby’s International Realty | CLHMS Million Dollar Guild | CNE | TRC | RSPS 305.978.7704 | AColeman@onesothebysrealty.com