


The data from Surfside’s past two months reveals a market in transition. Inventory sits in buyer’s market territory, transaction volume remains low, but a dramatic acceleration in closing velocity — particularly in July — suggests that the summer doldrums may be ending earlier than typical for ultra-luxury oceanfront.
This is not a market in crisis. It is a scarcity-constrained market where low transaction volume creates outsized volatility in monthly averages, and where July’s numbers tell a distinctly different story than June’s.
Executive Summary: June vs. July Contrast
June 2026: High inventory (7.4 months), moderate transaction volume (8 closings), slow marketing timeline (103 days on market), strong pricing discipline (98% sold-to-list ratio).
July 2026: Elevated inventory (7.9 months), reduced transaction volume (7 closings), accelerating velocity (35 days on market), disciplined pricing (94% sold-to-list ratio).
Key Shift: Days-on-market compressed by 66% month-over-month — from 103 days in June to 35 days in July. This dramatic acceleration suggests that the summer-slowdown narrative may be reversing faster than expected, with pending contracts from June moving to close in July at near-asking prices.
The Caveat: With only 7 closings in July, individual transaction characteristics (oceanfront penthouse vs. older inland condo) dominate the monthly average price-per-square-foot, making single-month readings less reliable than rolling averages or quartile analysis.
Inventory Analysis: Buyer’s Market Structure with Persistent Scarcity
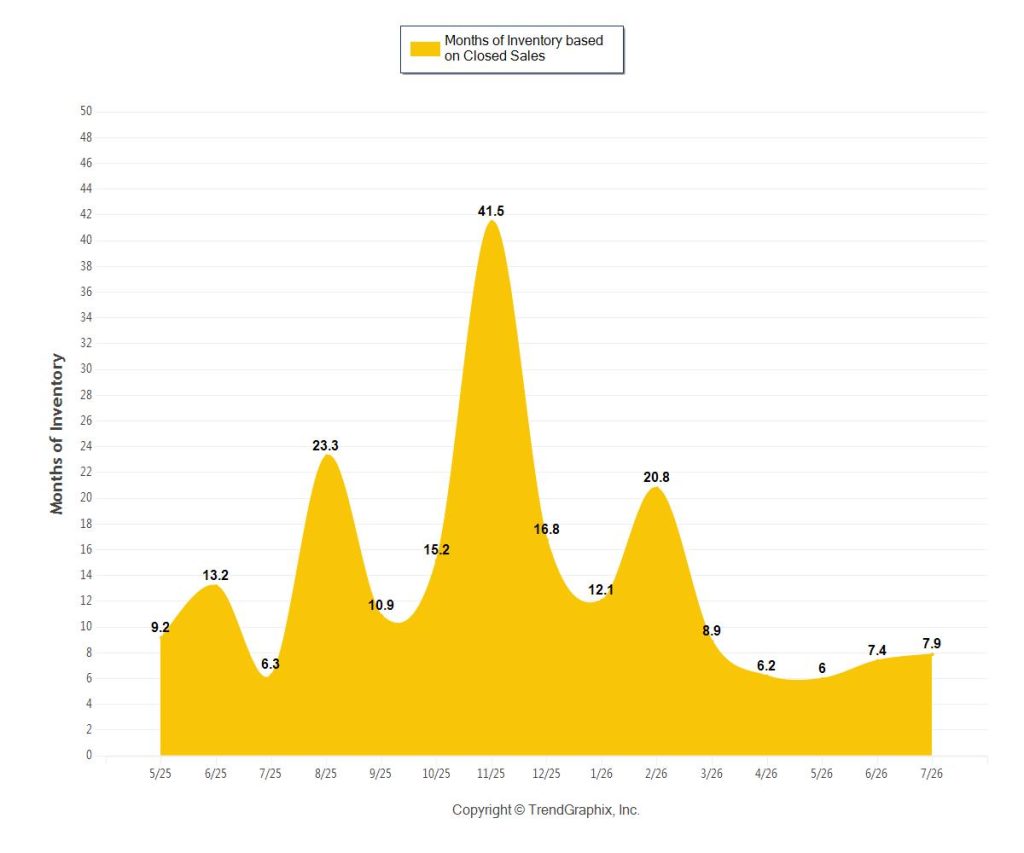
July’s months-of-inventory reading of 7.9 represents a buyer’s market by definition (anything above 6 months). This represents a 6.8% increase from June (7.4 months) and a 25.3% increase year-over-year from July 2025 (6.3 months).
What drives this inventory level: Surfside has 55 active listings (down 6.8% from June’s 59, down 27.6% from July 2025’s 76 listings). That active-listing count combined with only 7 closed sales produces the 7.9-month reading mechanically.
The year-over-year perspective is instructive. July 2025 showed 6.3 months of inventory with 76 active listings. July 2026 shows 7.9 months of inventory with 55 active listings. The inventory-to-sales ratio expanded not because listings flooded the market, but because active inventory contracted 27.6% year-over-year while transaction volume remains low and stable.
This is consistent with Surfside’s structural characteristic: a tiny town footprint (1.2 square miles) with a fixed oceanfront supply and a specific buyer profile (ultra-wealthy international capital plus domestic ultra-luxury seekers). Inventory expands and contracts cyclically, but the underlying supply is capped.
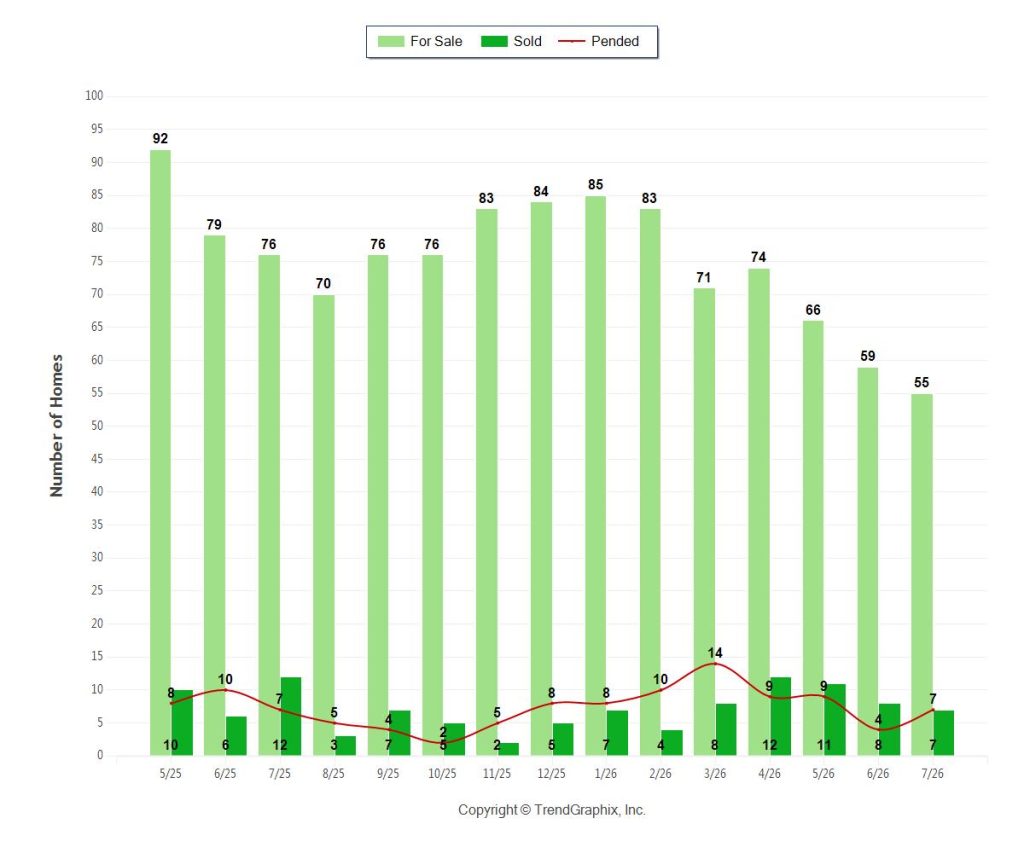
Pending contracts show a bright spot: July’s pending count was 7 units, up 75% from June’s 4 and flat with July 2025’s 7. A 75% month-over-month increase in pending contracts is a leading indicator that August and September 2026 will see higher closing volume than July’s 7 recorded. If that materializes, months-of-inventory will contract sharply.
Pricing: Transaction Mix Volatility and Price-Per-Square-Foot Noise
July’s average price-per-square-foot of $1,099 (sold) represents a 38.5% decline from June’s $1,788 and a 63.1% decline year-over-year from July 2025’s $2,977.
These swings are extreme and require careful interpretation. With only 7 closings in July, the price-per-square-foot average is heavily influenced by the specific properties that closed that month. A single oceanfront condominium closing in that month could have a property-type mix heavily weighted toward smaller, less expensive units compared to June’s mix.
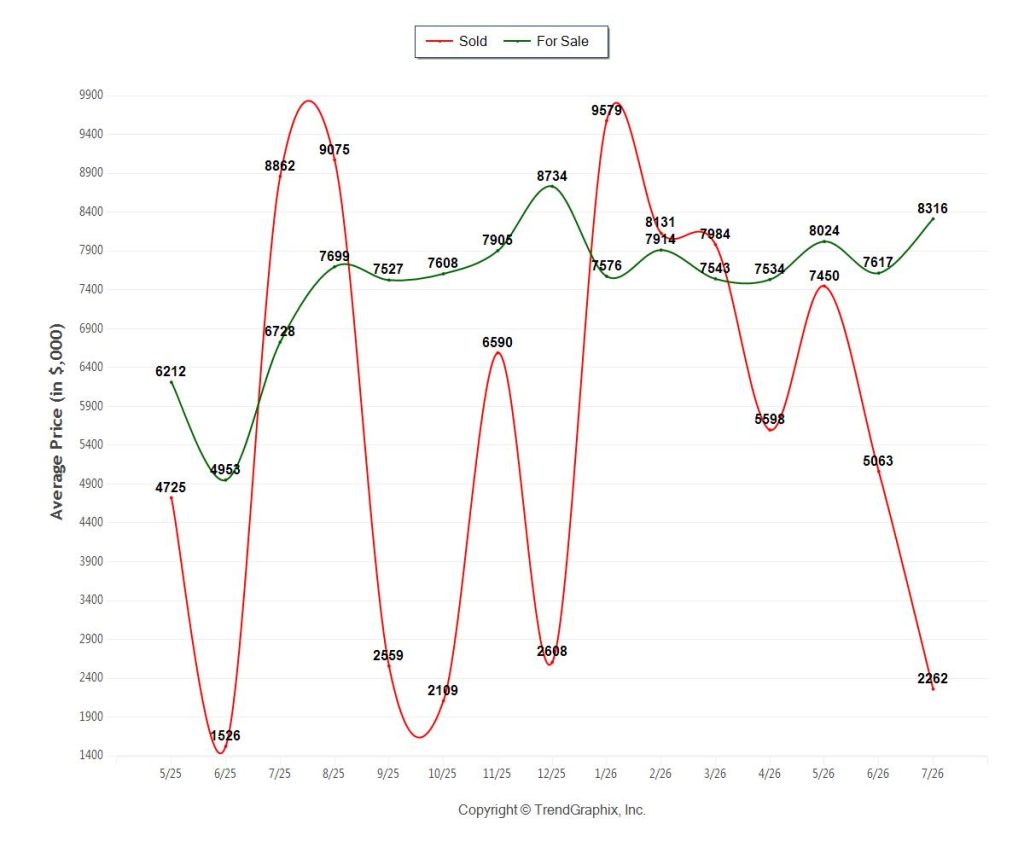
Context from broader data: Looking at the 3-year trend in average sold price (total value, not per-square-foot), July 2026 shows an average of $2.262 million, down 55.3% from June’s $5.063 million and down 74.5% from July 2025’s $8.862 million.
This volatility reflects the Billionaire’s Triangle dynamic: when ultra-high-value transactions close in a given month, the monthly average spikes dramatically. June 2026 may have included one or more nine-figure Surf Club or Seaway closings, which would explain the $5.063M average and the elevated price-per-square-foot. July’s $2.262M average suggests a more balanced mix or a month with larger number of non-ultra-luxury closings.
The 6-month rolling average (not monthly) provides more durable positioning: Looking at the 3-year data, Surfside’s sustainable price level appears to sit in the $5.5M to $7.2M range for active listings (for-sale price), with sold prices tracking slightly lower at $4.5M to $6.5M on average. This reflects the mix of ultra-luxury oceanfront units, established buildings, and bay-adjacent alternatives.
Days-on-Market: The July Acceleration
The most significant move in July’s data is days-on-market: 35 days, down 66% from June’s 103 days and down 77.7% from July 2025’s 157 days.
A 35-day marketing timeline is exceptionally fast for ultra-luxury oceanfront real estate, which typically takes 90-200+ days to sell. The 66% month-over-month compression suggests one of two scenarios: either June’s inventory was dominated by slower-moving or overpriced properties, or July’s closings were on properties with much shorter marketing timelines (recent listings, well-priced, high-demand units).
The year-over-year comparison is even more striking: 35 days in July 2026 vs. 157 days in July 2025 represents an 77.7% acceleration. If this holds through August and September, it would indicate a material shift in buyer traffic and closing velocity post-summer.
Sold-to-list ratio provides context: At 94% (sold-to-list), July demonstrates pricing discipline. Properties are selling at 94 cents on the dollar, which is not a concession — it is consistent with prior years. This held-firm ratio combined with dramatically faster days-on-market suggests the speed improvement comes from better pricing alignment and stronger buyer activity, not from sellers desperately discounting.
Transaction Volume: The Limiting Variable
July recorded 7 closed sales against 55 active listings. This low closing volume is typical for ultra-luxury oceanfront markets but creates outsized influence for each individual transaction on the month’s average statistics.
The June-to-July comparison shows closings declined from 8 to 7 (down 12.5%). Year-over-year, July 2026’s 7 closings compare against July 2025’s 12 closings (down 41.7%).
However, the pending spike in July (7 contracts, up 75% from June’s 4) suggests that August and September 2026 will see materially higher closing volume if those contracts convert at typical rates. For context, a 75% month-over-month increase in pending contracts, if converted to closed sales with the typical 30-45 day closing period, could produce 12-15 closings in August or September 2026.
If that materializes, it would bring months-of-inventory down sharply and reduce the monthly noise from low transaction volume.
The Delmore Factor: Still a Headwind?
The Delmore (8777 Collins Avenue, DAMAC’s Zaha Hadid-designed 37-residence tower) has not sold a single unit since sales launched in January 2025. With zero closings and zero pending contracts (as far as public data shows), The Delmore remains a notable absence from Surfside’s transaction count.
This project is not counted in the TrendGraphix data above (which covers sold and active transactions), but it is a context point: there are 37 units of new inventory sitting unsold in the town’s most prominent new development, which underscores why Surfside’s published “active inventory” remains relatively low. The Delmore is a data point about new construction specifically, not about the resale market or the broader “buyer’s market” inventory level the neighborhood is experiencing.
For buyers and sellers evaluating Surfside’s market health, the distinction is important: the resale market (Surf Club, established buildings, oceanfront stock) is functioning normally with buyer’s market inventory levels, strong pricing discipline, and accelerating velocity. The new-construction anchor (The Delmore) remains a separate and struggling category, as documented in the neighborhood guide.
Year-to-Date Performance: Q1 vs. Q2 2026 Context
Looking at the broader 2026 trajectory:
June 2026 (end of Q2): Active listings at 59, months of inventory at 7.4, average sold price per square foot at $1,788.
July 2026 (start of Q3): Active listings at 55, months of inventory at 7.9, average sold price per square foot at $1,099 (lower due to transaction mix).
The Q2 average across the quarter would show a somewhat tighter inventory and higher transaction velocity than the all-year 2026 average might suggest. If July’s acceleration in closing velocity persists, Q3 2026 will show notably different characteristics from Q2.
Three-Year Trend: What the Long Arc Reveals
The 3-year data (June 2023 to July 2026) shows Surfside as a market of extreme volatility and cyclical patterns:
Inventory Trend: Peaked at approximately 46 months in Q1 2024 (an extreme buyer’s market that did not produce the expected volume collapse, owing to the structural scarcity of the market). Currently at 7.9 months, which is well within normal ranges. The oscillation suggests Surfside cycles between buyer’s market (8-15 months) and tighter markets (3-6 months) on a roughly 18-month rhythm.
Pricing Trend: Average sold prices have ranged from approximately $1.5M to $8.8M depending on transaction mix. The 3-year range underscores how low transaction volume creates data noise. A more reliable metric is the sold-to-list ratio, which has remained 82-100% throughout the entire period, demonstrating consistent pricing discipline.
Days on Market Trend: Ranges from 20+ days to 240+ days depending on the month and the specific transaction mix. The 77.7% year-over-year improvement from July 2025 to July 2026 is notable but should be monitored for one or two more months to confirm it’s a sustainable trend rather than a single-month anomaly driven by transaction mix.
Sold-to-List Ratio Trend: Consistently 85-100%, currently at 94%. This is the most stable and actionable metric — it shows that pricing discipline has never been an issue in Surfside. Properties that sell do so at near-asking prices.
Market Positioning: Surfside’s Tier Within Ultra-Luxury Oceanfront
Surfside remains structurally differentiated from both Bal Harbour and Sunny Isles Beach:
vs. Bal Harbour: Bal Harbour’s July reading was 13.3 months of inventory with $2,879 per square foot average sold price. Surfside’s 7.9 months and $1,099 per square foot represent a tighter inventory and lower price-per-square-foot, but again, this is largely a transaction-mix artifact. Bal Harbour’s higher per-square-foot reflects its stronger ultra-luxury oceanfront positioning; Surfside’s includes a broader range of properties.
vs. Sunny Isles Beach: Data for Sunny Isles not provided in this analysis, but Sunny Isles typically shows higher transaction velocity (more closings per month) owing to higher-density new construction (Bentley, Turnberry, Estates at Acqualina) and a larger available inventory footprint.
Surfside remains the boutique tier: smallest footprint, most selective buyer pool, lowest transaction volume, and extreme month-to-month volatility in average statistics.
What July’s Data Actually Tells Sellers and Buyers
For Sellers: The 35-day average days-on-market is unusually fast and suggests that the summer slowdown may be ending earlier than typical. If you’re marketing a Surfside property in August or September 2026, the velocity data from July is an encouraging signal. However, pricing discipline (94% sold-to-list) remains unchanged — overpriced properties will still take 150+ days to move. Realistic pricing continues to be essential.
For Buyers: The buyer’s market inventory level (7.9 months) provides choice and negotiating leverage compared to tighter markets. However, the strong sold-to-list ratio (94%) and accelerating closing velocity suggest that properties priced correctly are moving quickly. Buyers should expect competitive situations on well-priced oceanfront stock and may need to move decisively when the right property hits the market.
For Investors: Surfside’s structural scarcity (fixed oceanfront supply in a 1.2-square-mile town) continues to support long-term appreciation despite cyclical inventory swings. The current buyer’s market is not a distress signal; it is a normal cyclical inventory level in a market where transactions remain controlled by the scarce supply rather than by distressed sellers.
Market Outlook: Q3 2026
July’s pending-contract spike (7 contracts, up 75% from June) is the most actionable leading indicator. If those contracts convert to closings, August and September should see higher transaction volume than July’s 7 closings. This would compress months-of-inventory toward the 5-6 month range and reduce monthly noise in price-per-square-foot averages.
Days-on-market may remain in the 40-80 day range if buyer traffic continues to accelerate into fall, which would be substantially faster than June’s 103 days.
Sold-to-list ratio should remain 92-98%, reflecting continued pricing discipline in a market where scarcity (not distress) drives sales.
Frequently Asked Questions
Is Surfside a buyer’s market or a seller’s market?
Structurally, it’s a buyer’s market (7.9 months of inventory is above the 6-month threshold). Functionally, it remains a disciplined market where sellers maintain pricing power (94% sold-to-list). This is a scarcity-driven buyer’s market, not a distress-driven one.
Why is the price-per-square-foot so volatile month to month?
With only 7 closings in a month, the transaction mix dominates the average. One oceanfront penthouse closing alongside six smaller inland or established-building units will produce a very different per-square-foot average than one month with all oceanfront ultra-luxury sales. The 3-year volatility (from $800 to $4,700+ per sqft) reflects this reality.
What does the July days-on-market acceleration mean?
The 66% reduction from 103 days in June to 35 days in July, combined with the 77.7% year-over-year improvement, suggests faster closing velocity driven by better-aligned pricing and potentially stronger buyer traffic post-summer. This should be monitored through August and September to confirm it’s a sustainable trend.
Should I sell my Surfside property now?
The buyer’s market inventory level provides choice for buyers but doesn’t mean lower prices. The 94% sold-to-list ratio and strong year-over-year appreciation suggest that correctly priced properties sell efficiently. Overpriced properties will languish regardless of market cycle. Consult with a local specialist to ensure your property is priced relative to comparable recent sales.
Is The Delmore’s lack of sales a sign of trouble?
The Delmore’s struggles are site-specific, not market-wide. The resale market and established buildings are functioning normally with good pricing discipline and accelerating velocity. Buyers’ reluctance to be first occupants on the former Champlain Towers South site is a specific friction point, not an indictment of Surfside’s broader market health.
Ready to Evaluate Surfside in Today’s Market?
Surfside in July 2026 presents a buyer’s market in inventory structure but a disciplined market in pricing behavior. The acceleration in closing velocity suggests summer-slowdown narrative may be reversing earlier than expected, but the small transaction volume demands that we monitor August and September to confirm sustainable trends versus monthly noise.
I specialize in Surfside ultra-luxury transactions across the full spectrum, from the Billionaire’s Triangle (Surf Club, Seaway, the incoming Hillcrest project) to established oceanfront stock and bay-adjacent alternatives.
Contact me directly to discuss what July’s market data means for your specific situation, whether buying, selling, or evaluating Surfside’s investment positioning.
📞 Call or text: 305.978.7704
📧 Email: AColeman@onesothebysrealty.com
🌐 Explore Surfside luxury residences
About Market Data
Market data in this report is sourced from TrendGraphix Facts and Trends reports based on Southeast Florida MLS records for Surfside, published August 2026 and reflecting closed sales through July 2026. All figures aggregated across all residential property types $1M+, including single-family homes, condominiums, villas, and townhomes. For detailed analysis segmented by oceanfront condos specifically or the ultra-luxury tier, contact me directly.

Contact: 305.978.7704 · AColeman@onesothebysrealty.com
Information provided is for informational purposes only and subject to change without notice. Market data and pricing are current as of July 2026 and sourced from MLS records. Verify all details directly with your broker or legal and financial advisors prior to making any investment or transaction decisions.