


Covering ZIP codes 33129, 33130, and 33131 — Brickell, Brickell Key, and the surrounding urban core.
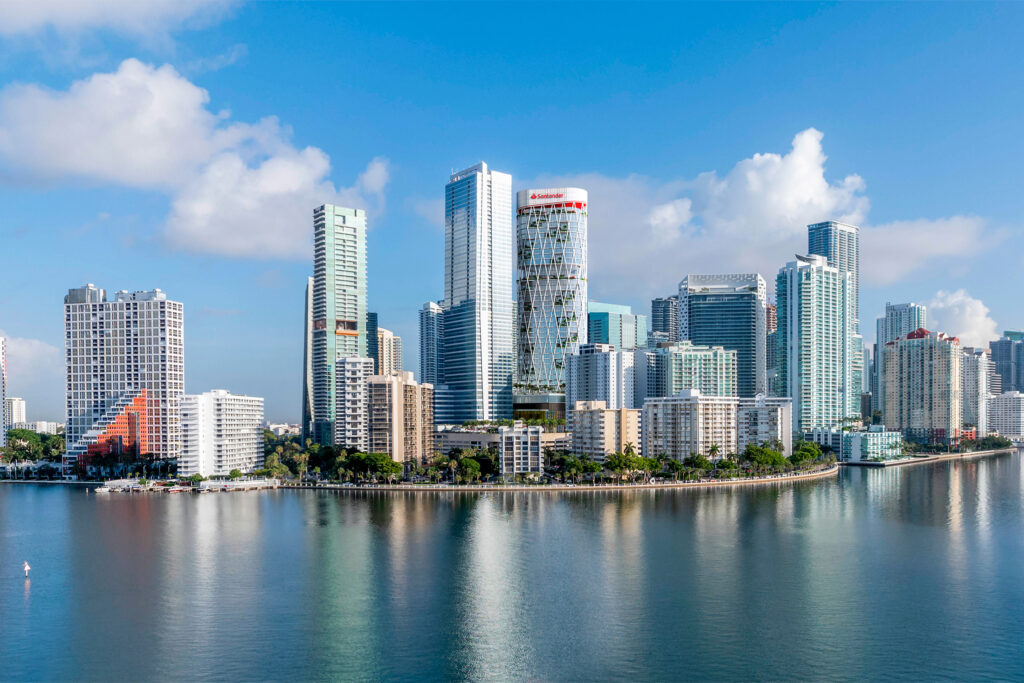
Brickell has been one of the most closely watched new-construction stories in Miami-Dade for the past several years, and for good reason: Cipriani Residences, St. Regis Residences Brickell, and Baccarat Residences have all delivered or are delivering into this corridor within a tight window of each other. That supply wave is a meaningful part of the backdrop to every number in this report — Brickell’s $1M+ condo market isn’t absorbing slowly because of weak demand; it’s absorbing against a genuinely heavy, concentrated new-construction pipeline.
A geographic note on this data: ZIP 33131 spans both Brickell and part of Downtown Miami, so this report’s inventory figures technically include Downtown Miami towers within that ZIP code, such as Waldorf Astoria Residences and Aston Martin Residences. Those two developments are excluded from the building references in this post since they’re Downtown Miami product, not Brickell — but readers should know the underlying MLS numbers aren’t perfectly Brickell-only by ZIP code alone.
The Headline Numbers
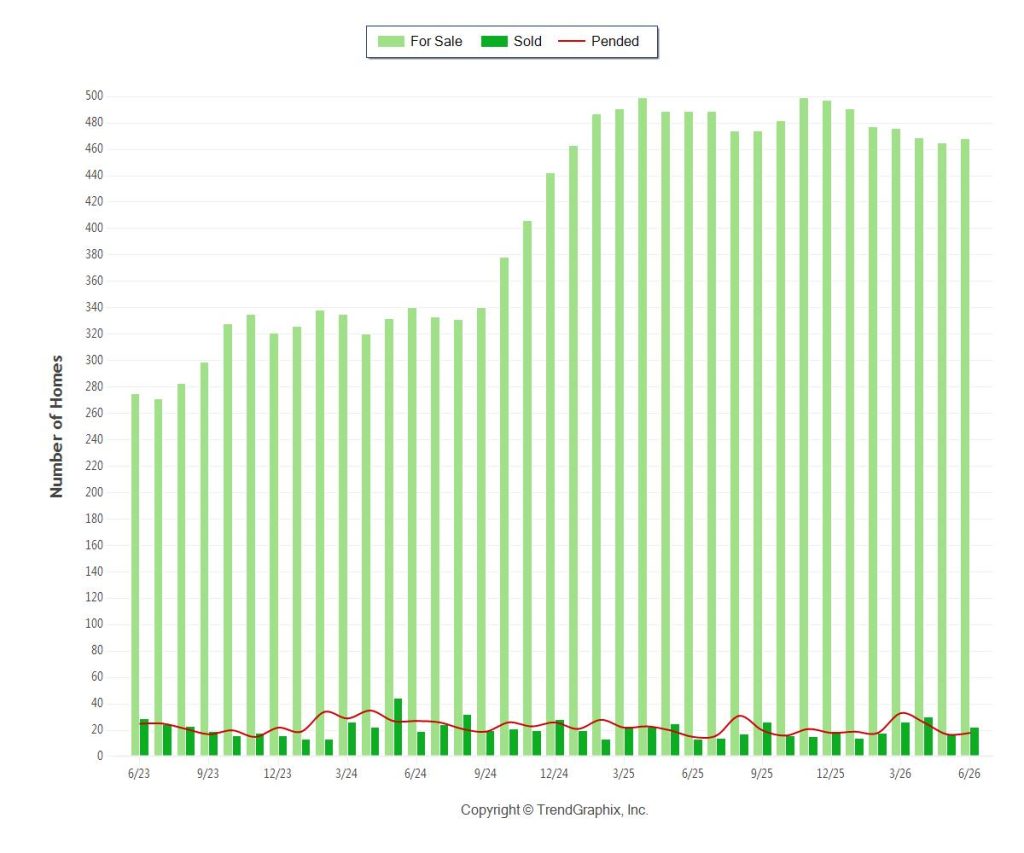
- Active listings: 431 in July 2026 (preliminary), down 7.9% month-over-month and down 11.9% year-over-year
- Closed sales: 18 in July, down 25% from June but up 28.6% year-over-year
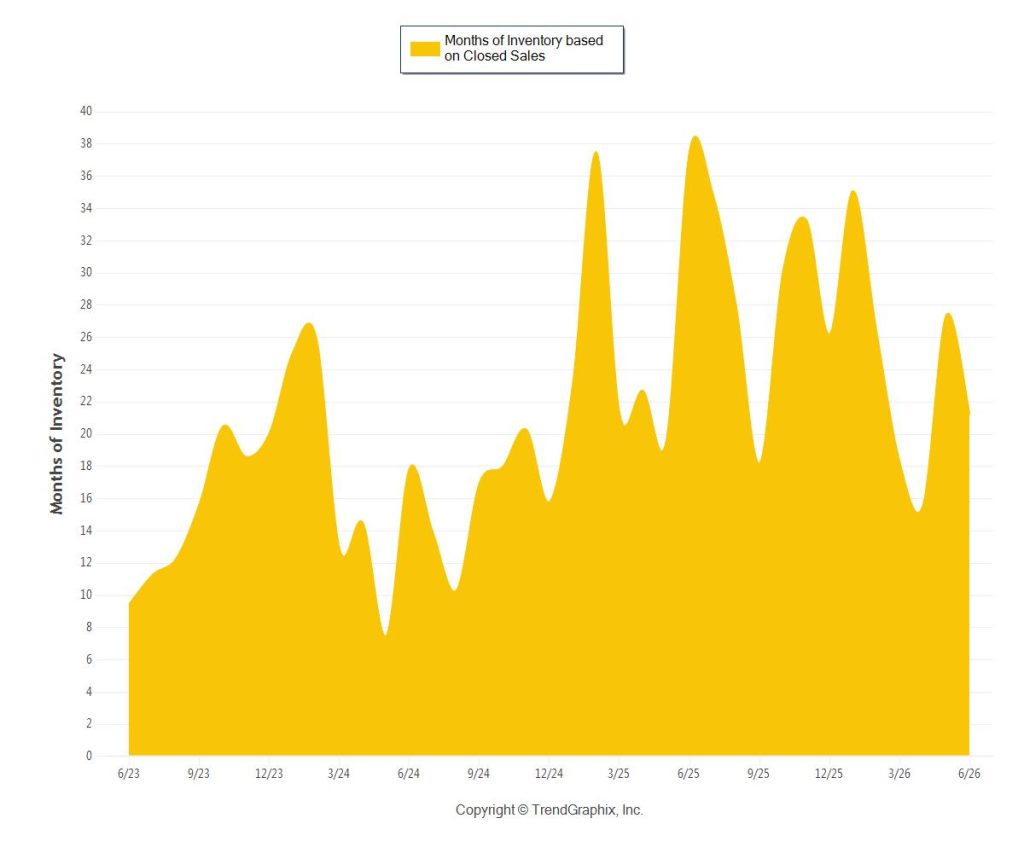
- Months of inventory: 23.9 in July — still deep in buyer’s-market territory (more than 6 months defines a buyer’s market by MLS standards), though sharply improved from 34.9 a year ago
- Average sold price per square foot: $970 in July, up 4.9% year-over-year
- Average days on market: 131 in July, up 65.8% year-over-year
An Honest Flag: These Two Reports Don’t Fully Agree With Each Other
Something worth explaining plainly, because it matters for how to read any single month of this data: the three-year historical report and the more recent preliminary report — both published in the same month — show different figures for June 2026. The three-year report lists June’s months of inventory at 21.3 and average days on market at 118; the more recent report’s monthly table shows June revised to 19.5 months of inventory and 112 days on market.
This isn’t an error in either report — it’s how MLS closed-sales data works. Closings get recorded over time, not all at once on the last day of the month, so the most recent month or two in any market report is preliminary and gets revised as more transactions are recorded. June’s numbers actually improved slightly between the two reports as more June closings were logged after the fact. The practical implication: treat the most recent month of any market report — especially July’s numbers in this one — as a rough early read, not a final figure. Absorption looked meaningfully better once June’s data settled, and July’s numbers should be expected to firm up similarly over the coming weeks.
Three-Year Context: A Market Working Through Oversupply
Brickell’s $1M+ inventory has been on a long, volatile arc. Months of inventory spiked above 37 in mid-2025 — a genuinely difficult stretch for sellers — before working down into the low-to-mid 20s more recently. That’s real progress, but it’s progress from an extreme starting point, not a market approaching balance. At 20-24 months of inventory, Brickell remains roughly four to six times the threshold that would define even a neutral market (3-6 months), let alone a seller’s market (under 3 months).
Absorption rate — the share of active inventory selling each month — has mostly run in the 3-6% range over the past three years, occasionally dipping below 3% during the worst of the 2025 supply glut. July’s reading of roughly 4.2% is squarely within that established range, not a breakout in either direction.
Pricing: Volatile, Not Necessarily Declining
Average sold price and average price per square foot both swing considerably month to month in this data set — a $901 per-square-foot reading in June followed by $970 in July, for instance. With only 18-24 closings in a given month across three ZIP codes spanning both older Brickell inventory and new-construction penthouses, a handful of high-end or low-end transactions can move the average substantially without reflecting a genuine market-wide shift. The median sold price figures (reported only quarterly in this data set, most recently $1.65M) are a steadier reference point than the monthly average for gauging real price direction.
What This Means If You’re Buying or Selling in Brickell
If you’re selling: The oversupply from the new-construction wave is a real headwind, and 130+ average days on market reflects genuine buyer selectivity. Pricing precisely against recent comparable closings — not against the new-construction list prices next door — is more important in Brickell right now than in almost any other Miami-Dade submarket.
If you’re buying: With inventory still running four to six times a balanced market’s level, negotiating room remains real. The Sold/Original List Price ratio sitting in the high-80s to low-90s percent range across this data set confirms sellers are still conceding meaningfully off original ask.
Frequently Asked Questions
Is Brickell a buyer’s or seller’s market right now?
Yes, clearly. At roughly 20-24 months of inventory based on closed sales, Brickell’s $1M+ condo market is deep in buyer’s-market territory — well above the 6-month threshold, let alone the 3-month seller’s-market line.
Why did Brickell’s inventory get so high in 2025?
A concentrated wave of new-construction deliveries — including Cipriani Residences, St. Regis Residences Brickell, and Baccarat Residences — added substantial new supply to the market within a relatively tight window, pushing months of inventory above 37 at its 2025 peak. Note that this report’s ZIP-code-based data (33131 in particular) also captures some Downtown Miami new construction outside Brickell proper, such as Waldorf Astoria and Aston Martin Residences.
Should I trust the most recent month’s numbers in this report?
Treat them as a preliminary read. MLS closed-sales data gets revised as transactions are recorded after the fact, so the most recent one to two months in any market report typically firm up — usually favorably — over the following weeks. This report shows that revision happening directly between June’s first-reported figures and its later-revised ones.
What’s driving average price swings month to month?
Small transaction volume. With under 25 closings most months across a $1M+ price range that spans both resale units and new-construction penthouses, individual high-end sales can swing the average meaningfully without reflecting the broader market.
Market data sourced from MLS TrendGraphix Facts and Trends reports, published July 2026, covering ZIP codes 33129, 33130, and 33131. Data is provided by the Realtor Association of Miami; neither the Board nor its MLS guarantees its accuracy, and the most recent month’s figures are preliminary and subject to revision. ONE Sotheby’s International Realty is the sales team for select new-development coastal properties referenced across this site.
Ashton Coleman, Broker-Associate, ONE Sotheby’s International Realty | CLHMS Million Dollar Guild | CNE | TRC | RSPS 305.978.7704 | AColeman@onesothebysrealty.com